![]() |
|||||||||||||||||||||||||||||||||||||||||||||||||||||||||||||||||||||||||||||||||||||||||||||||||||||||||||||||||||||||||||||||||||||||||||||||||||||||||||||||||||||||||||||||||||||||||||||||||||||||||||||||||||||||||||||||||||||||||||||||||||||||||||||||||||||||||||||||||||||||||||||||||||||||||||||||||||||
|
|||||||||||||||||||||||||||||||||||||||||||||||||||||||||||||||||||||||||||||||||||||||||||||||||||||||||||||||||||||||||||||||||||||||||||||||||||||||||||||||||||||||||||||||||||||||||||||||||||||||||||||||||||||||||||||||||||||||||||||||||||||||||||||||||||||||||||||||||||||||||||||||||||||||||||||||||||||
| �
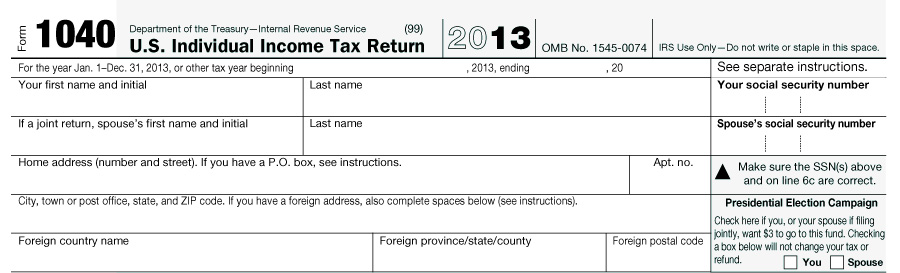
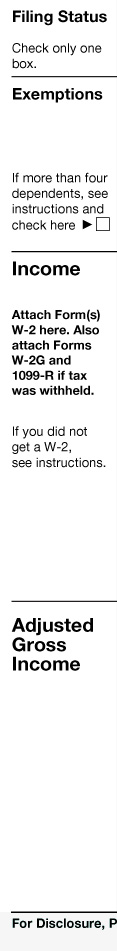
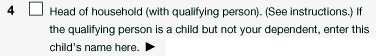
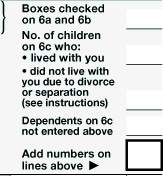
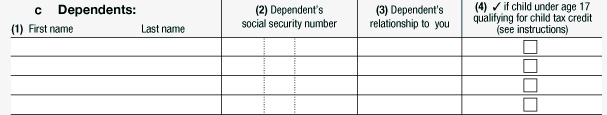
Interactive Tax Forms
The Tax Policy Center has put together this interactive tool to tell you a little about what is behind the tax forms. What does each line mean? How many people make an entry? How does it affect revenues and the distribution of tax burdens across income categories? This inaugural version includes form 1040�the most commonly used return�along with Schedule A for itemized deductions. Over time, we will update information and add more forms. Click on a link to bring up a form. Then hover your cursor over a line to see basic information and click to bring up a box with additional information.
Line 1
Unmarried individuals without dependents or who do not maintain their own household file as single.In 2011, 67.3 million taxpayers filed as single, accounting for 46 percent of all returns. Line 2
Married couples generally file one joint return that combines the income and expenses of both spouses.In 2011, 53.4 million married couples filed joint tax returns, accounting for 37 percent of all returns. Line 3
Married couples may file two tax returns, reporting each spouse's income and expenses separatelyIn 2011, 2.6 million married individuals filed separate tax returns, accounting for about 2 percent of all returns. Line 4
An unmarried individual who maintains his/her own household and has dependents may file as Head of HouseholdIn 2011, 22.1 million taxpayers filed as head of household, accounting for 15 percent of all returns. Line 5
A widow(er) may file a joint return as married in the year of a spouse�s death. For the next two years, the surviving spouse may continue to file a joint return if s/he maintains a household and has a dependent son or daughter.In 2011, 69 thousand widow(er)s filed as surviving spouses, accounting for less than one-twentieth of 1 percent of all returns. Line 6a
A taxpayer may claim an exemption for him/herself, his/her spouse, and all dependents.In 2011, 94 percent of tax filers claimed exemptions for themselves. Tax filers who are claimed as dependents on another person�s tax return may not claim exemptions for themselves. Line 6b
A taxpayer may claim an exemption for him/herself, his/her spouse, and all dependents.In 2011, 37 percent of taxpayers claimed an exemption for their spouse. Line 6c
A taxpayer may claim exemptions for children under age 19 (under age 24 if they are at least half-time students) and for other dependents.In 2011, taxpayers claimed a total of 99.3 million dependent exemptions, 85 percent of which were for children. Line 7
Income earned from job(s).In 2011, nearly 120 million tax returns reported $6 trillion of earnings.
Line 8a
Interest earned on bank accounts and bonds.In 2011, 52 million tax returns reported $120 billion of taxable interest.
Line 8b
Interest paid on municipal and state bonds on which individuals pay no federal income tax.Nearly 6 million taxpayers reported $73 billion dollars of tax-exempt interest in 2011.
Line 9a
Dividends paid to shareholders by corporations or mutual funds.Almost 28 million taxpayers reported $195 billion dollars of ordinary dividends in 2011.
Line 9b
Dividends that are subject to a lower tax rate than ordinary income. Qualified dividends are identified separately on information returns provided by payers.In 2011, 25 million taxpayers reported $142 billion in qualified dividends.
Line 10
Some or all of any refund of 2012 state and local income taxes. The amount of any refund included as income on 2013 tax returns is determined using the State and Local Income Tax Refund worksheet.In 2011, 22 million taxpayers reported $27.5 billion dollars in state and local income tax refunds.
Line 11
Alimony or separate maintenance payments received in 2013. The person making these payments may exclude them from taxable income on his/her income tax return.Fewer than 437 thousand tax returns reported $8.8 billion dollars in alimony payments in 2011.
Line 12
Income (net of expenses) earned from a business or sole proprietorship as reported on Schedule C or C-EZ.In 2011, over 17 million taxpayers reported net business income of $337 billion. Approximately 5.5 million taxpayers reported $54 billion in net business losses.
Line 13
Gain or loss from the sale of an asset such as a stock or bond.Over 20 million taxpayers reported capital gains of $375 billion in 2011.
Line 14
Gains or losses from the sale of assets used in a trade or business.In 2011, 2 million taxpayers reported other gains or losses that added to a net loss of $14 billion.
Line 15a
Amount withdrawn from Individual Retirement Accounts (IRA) during the tax year.Almost 14 million tax returns reported more than $263 billion in IRA distributions in 2011. Line 15b
Amount of withdrawals from IRA that is subject to income tax.In 2011, 13 million taxpayers reported $217 billion in taxable IRA distributions.
Line 16a
Amounts received from pensions or annuities.Nearly 29 million taxpayers reported almost $911 billion in pensions and annuities income in 2011.
Line 16b
Amount of pension or annuity payments that is subject to income tax.In 2011, nearly 27 million taxpayers reported $581 billion of taxable pensions and annuities.
Line 17
Income from rental property, royalties, partnerships, S corporations, estates, trusts, and other entities, net of expenses.In 2011, 16.8 million taxpayers reported Schedule E income of $486 billion.
Line 18
Profit or loss from farming.In 2011, 600,000 taxpayers reported farm income of $14.5 billion, while almost 1.3 million reported farm losses totaling over $24 billion.
Line 19
Total unemployment compensation received, net of contributions to unemployment or family leave programs, and repayment of excess compensation in prior years.Over 13 million taxpayers reported more than $92 billion in unemployment compensation in 2011.
Line 20a
Total Social Security benefits received.Nearly 26 million taxpayers reported $491 billion in Social Security benefits in 2011.
Line 20b
Taxable amount of Social Security benefits. Between 0 and 85 percent of benefits are taxable, depending on recipient�s income.Nearly 17 million tax returns reported a total of $202 billion of taxable social security benefits in 2011.
Line 21
All taxable income not reported in other categories, including most prizes and awards, gambling winnings, pay for jury duty, canceled debts, and other income.In 2011, 6.5 million tax returns reported $34 billion of other income.
Line 22
Total income subject to income tax, before adjustments.Total income for 145 million taxpayers was $8.5 trillion in 2011.
Line 23
Educators may deduct up to $250 in spending on qualified education expenses, such as books, supplies, equipment, and other materials used in the classroom.Nearly 4 million taxpayers reported slightly less than $1 billion in educator expenses in 2011.
Line 24
Expenses incurred as an employee that are not reimbursed by employer.Over 147 thousand taxpayers reported $518 million of certain business expenses of reservists, performing artists, and fee-basis government officials in 2011.
Line 25
Contributions made to an Archer health savings account (except those made by employers) for individuals and families with high-deductible health plans.Roughly 1 million tax returns reported $3 billion of health savings account deductions in 2011.
Line 26
Unreimbursed moving and travel expenses.Approximately 1 million taxpayers reported just under $3 billion in moving expenses in 2011.
Line 27
People with business, sole-proprietorship, or farm income may deduct half of the self-employment tax paid to fund Social Security and Medicare.In 2011, more than 18 million tax returns reported deductible self-employment tax payments totaling $26 billion.
Line 28
Contributions by self-employed individuals to qualified retirement plans.In 2011, 900,000 taxpayers reported more than $19 billion of contributions to self-employed Simplified Employee Pension (SEP), Savings Incentive Match Plan for Empoyees (SIMPLE), and qualified plans.
Line 29
Premiums paid for health insurance by self-employed individuals, net of deductible self-employment tax and deductible contributions to retirement plans.Almost 4 million taxpayers reported more than $24.5 billion of self-employed health insurance deductions in 2011.
Line 30
Penalty imposed on early withdrawals from deferred-interest accounts.In 2011, 900 thousand returns reported more than $19 billion of contributions to self-employed SEP, SIMPLE, and qualified plans.
Line 31a
Alimony or separate maintenance payments made in 2013.In 2011, 580 thousand tax returns reported alimony payments totaling more than $10.5 billion.
Line 32
Contibutions made to deductible IRAs.Over 2.5 million returns reported $11 billion in contributions to IRAs in 2011.
Line 33
Taxpayers may deduct up to $2,500 of interest paid on student loans, subject to income and filing limitations.Ten million returns claimed nearly $10 billion in student loan interest deductions in 2011.
Line 34
Taxpayers may deduct up to $4,000 of qualifying tuition and fees, subject to income limits.In 2011, almost 2 million taxpayers deducted more than $4 billion in tuition and fees.
Line 35
Taxpayers may deduct up to 9 percent of qualified domestic production activities income.In 2011, 640,000 individual income taxpayers reported $9 billion of deductible income from domestic production activities.
Line 36
Total deductions allowed against total income in the calculation of adjusted gross income.Almost 36 million tax filers claimed a total of over $124 billion of �above-the-line� deductions in 2011.
Line 37
Total income subject to tax before exemptions and either the standard or itemized deductions.Adjusted gross income in 2011 totaled $8.4 trillion, reported on over 145 million tax returns.
|
|||||||||||||||||||||||||||||||||||||||||||||||||||||||||||||||||||||||||||||||||||||||||||||||||||||||||||||||||||||||||||||||||||||||||||||||||||||||||||||||||||||||||||||||||||||||||||||||||||||||||||||||||||||||||||||||||||||||||||||||||||||||||||||||||||||||||||||||||||||||||||||||||||||||||||||||||||||
© Urban Institute, Brookings Institution, and individual authors, 2013. Site Map | Privacy Policy | Support TPC | Contact Us |
|||||||||||||||||||||||||||||||||||||||||||||||||||||||||||||||||||||||||||||||||||||||||||||||||||||||||||||||||||||||||||||||||||||||||||||||||||||||||||||||||||||||||||||||||||||||||||||||||||||||||||||||||||||||||||||||||||||||||||||||||||||||||||||||||||||||||||||||||||||||||||||||||||||||||||||||||||||


