Enrollment
States vary considerably in their distribution of enrollment between public two-year and four-year institutions, the share of out-of-state students, and enrollment growth.
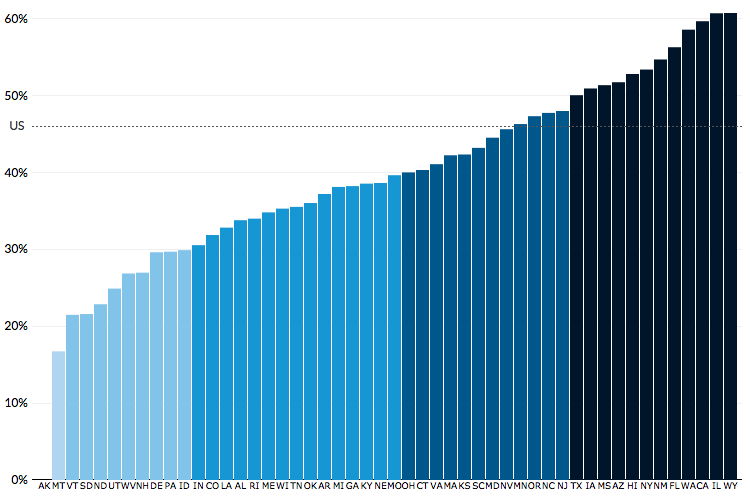
Share of Public Undergraduate Enrollment in Two-Year Institutions, Fall 2012
Having low two-year tuition and fees is more significant in a state where a larger proportion of students attend two-year institutions. Large states (e.g., California, Florida, Illinois, New York, and Texas) tend to have high proportions of students in two-year institutions, driving the national average far above the share in most states.
Share of public enrollment in two-year institutions:
Share of public enrollment in two-year institutions
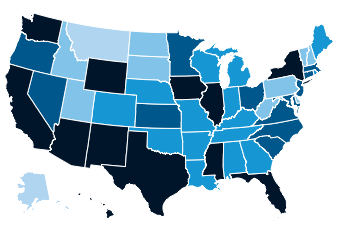
Source: Calculations from Integrated Postsecondary Education Data System by the College Board.
Notes: Based on full-time equivalent undergraduate student enrollment in degree-granting institutions; Alaska does not have a community college system.
Data: Enroll.TwoYear tab.
Notes: Based on full-time equivalent undergraduate student enrollment in degree-granting institutions; Alaska does not have a community college system.
Data: Enroll.TwoYear tab.
Migration Across State Lines for All First-Time College Students, Fall 2012
In some states, like Mississippi and Utah, leaving the state to enroll in college is very unusual. In other places, like New Jersey and Vermont, nearly half of college-going high school graduates enroll out of state. States do not have to fund education for those who leave the state, and most states do not provide grant aid to out-of-state students.
States where relatively few students remain in state tend to have a larger proportion of enrollment of students from out of state. Though regional agreements do exist to lower out-of-state tuition for students from neighboring states, states with many out-of-state students at their public institutions bring in more tuition revenue because tuition and fees are higher for these students.
College-going high school graduates who enroll in state
:
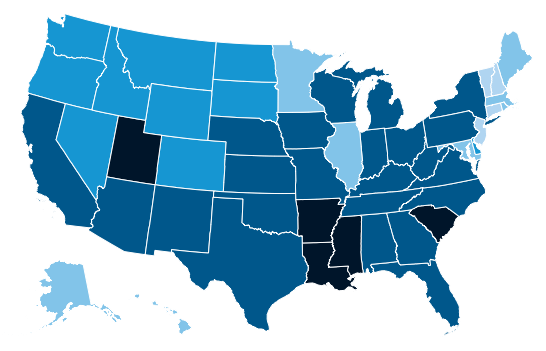
First-time college students who are from another state
:
Source: National Center for Education Statistics (NCES), Digest of Education Statistics, 2013, Table 309.20.
Note: These figures are for students attending both public and private institutions.
Data: Enroll.Migration tab.
Note: These figures are for students attending both public and private institutions.
Data: Enroll.Migration tab.
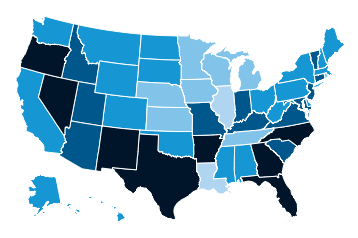
Percentage Change in Public Enrollment since Fall 2000
Rapid enrollment growth between fall 2000 and fall 2010 was a significant factor in declining per student funding over this period, with the Great Recession accelerating the trend. Nationally, enrollment peaked in fall 2010. It has since declined in most states, but has continued increasing in several others.
Large southern states with dramatic increases in enrollment since fall 2000 have driven the national trend upward, while California and Illinois have grown more slowly and have put downward pressure on the national average. States such as Massachusetts, New York, and Pennsylvania, on the East Coast, have followed the national trend, while many smaller states have experienced larger swings in enrollment (e.g., Louisiana, Oregon).
Enrollment in fall 2013:
Increase since fall 2000:
Increase since fall 2000:
Increase in enrollment since fall 2000
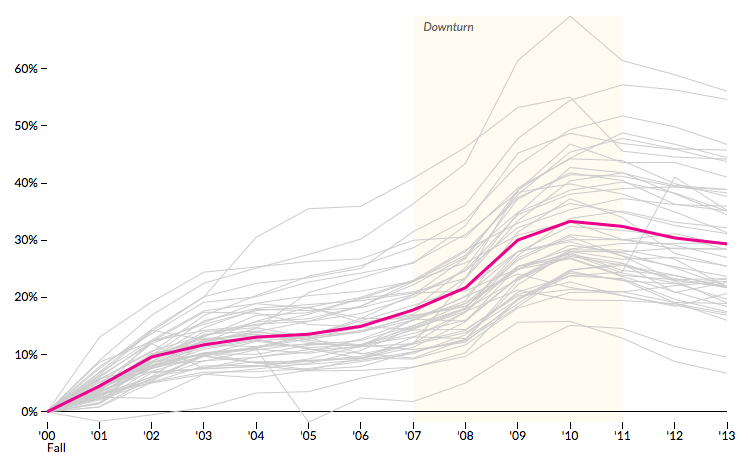
Sources: NCES, Digest of Education Statistics, various publication years and tables for fall 2000 through fall 2013 data.
Note: Based on full-time equivalent enrollment in degree-granting institutions.
Data: Enroll.Change tab.
Note: Based on full-time equivalent enrollment in degree-granting institutions.
Data: Enroll.Change tab.