Passport to Prosperity
Indianola, Mississippi
Writing & Photography by Matthew Johnson


The story of Indianola, Mississippi, is a veritable tale of two cities.
On its surface, Indianola is rich with history and seems like an opportune place to live. It’s the home of blues legends Albert and B. B. King and of the first black female Postmaster, Minnie Cox; it’s the seat of power for Sunflower County; and it’s home to Tom and Walton Gresham, owners of the Double Quick convenience store chain and Gresham Petroleum Co.
Yet times have been tough in Indianola. Many of the agricultural and manufacturing jobs that long buoyed the city’s economy are now obsolete, and other jobs moved overseas. Delta Pride, a large catfish processing plant, closed its doors in 2011, and a lot of people are now out of work.
But the economic pain was not distributed evenly. It never has been.
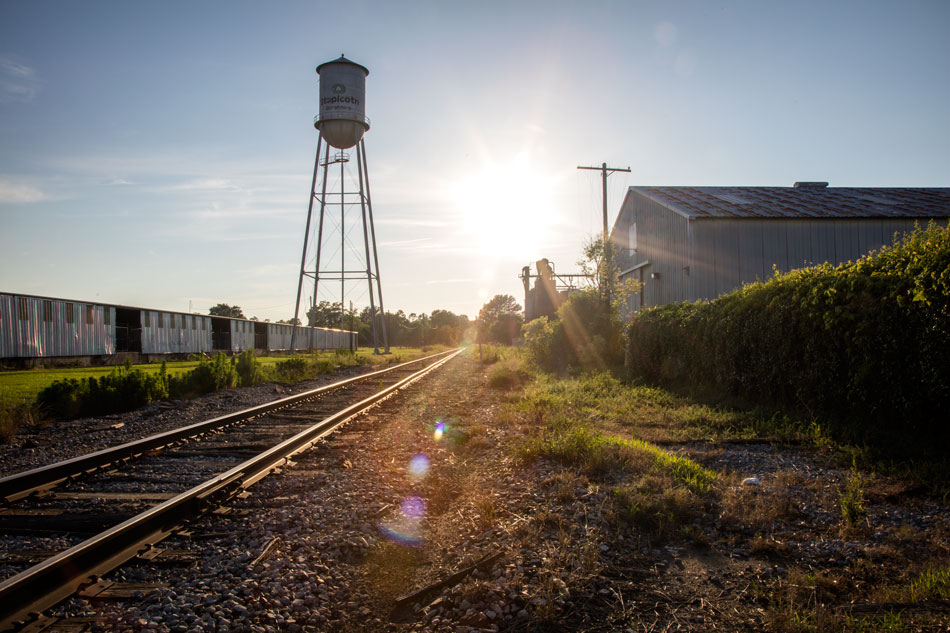
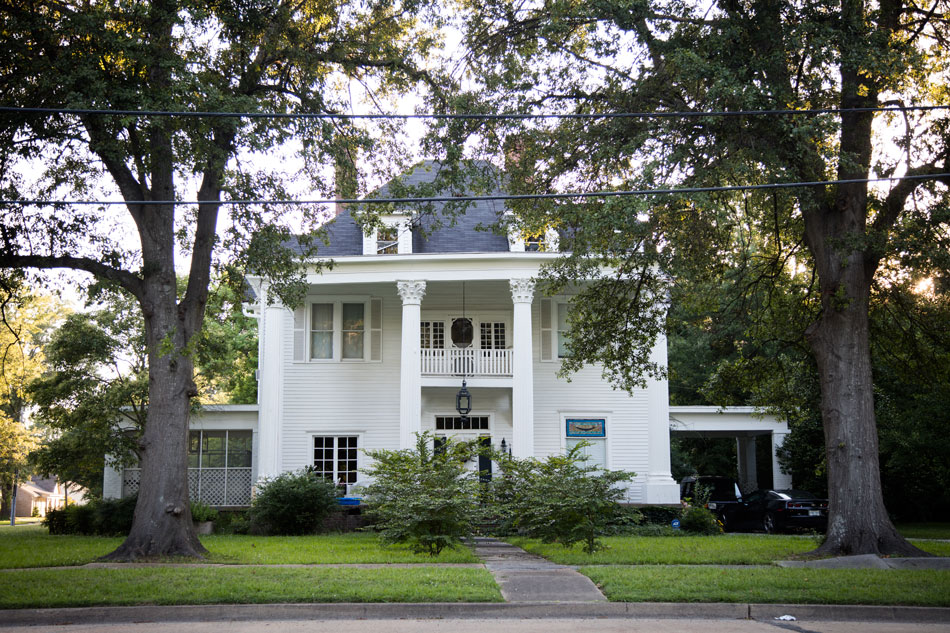
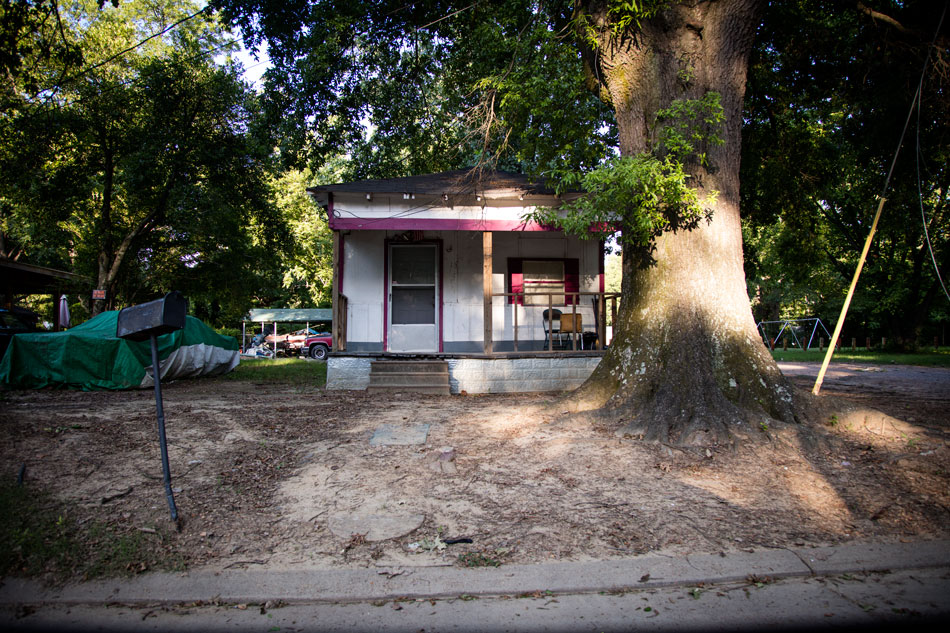
Indianola is effectively torn in two by railroad tracks running east to west across the city’s 8.7 square miles of flat terrain and out through the farmland of the Mississippi delta. On the north side of the tracks lie columned southern homes with large, green front lawns. To the south are dilapidated wooden shotgun houses with smaller, less-seeded yards.
On the north side lives Indianola’s white community, which composes almost 16 percent of the city’s 10,426 residents. On the south side live the city’s black residents, who constitute most of the rest of the population.
Commercial centers, strip malls, and retail jobs are north of the tracks, but few stores lie to the south.
And the disparity of opportunities similarly extends to the schools where Indianola’s children are educated.
The Indianola Academy was founded on the north side of the tracks in 1965 specifically to help white families avoid desegregating schools. South of the tracks is Lockard Elementary, Carver Elementary, Robert L. Merritt Junior High, and Gentry High School, which are attended almost exclusively by children from Indianola’s black families.
Still, Indianola is perhaps the most viable economy in the region, so if a change were going to reinvigorate the Delta, it would be a good place to start.
Looking at the success of the Harlem Children’s Zone in New York, the Department of Education in 2010 began offering grants to encourage more places to create their own children’s zones, or Promise Neighborhoods.
The big idea is to attack poverty in a community by starting with its most vulnerable members: children. Broadly, Promise Neighborhoods aim to provide a cradle-to-career network of educational programs and supports for kids from low-income families as well as other programs to help their parents make ends meet.
The hypothesis is that a community will transform over time when children receive robust support throughout their childhoods, and those children will grow into productive citizens and stewards of their hometown or city.
The primary tool for making all this happen is results-driven collection and analysis of data, allowing real-time, informed choices that can tailor the programs to better educate children, help their families prosper, and ultimately unite the community.
| Demographics | Mississippi | Indianola |
|---|---|---|
| Population | 2,984,345 | 10,426 |
| African American | 37.3% | 82.3% |
| White | 59.3% | 15.8% |
| Children under age 18 | 24.9% | 26.1% |
| Median age | 36.3 | 33 |
| Total housing units | 1,284,794 | 4,060 |
| Median household income | $39,464 | $27,181 |
| Unemployment rate | 10.9% | 19.4% |
| Individuals below the federal poverty level | 22.6% | 34% |
| High school graduate or higher | 81.9% | 76.4% |
Source: American Community Survey 5-Year Estimates, 2010–14.
| Demographics | Mississippi | Indianola |
|---|---|---|
| Population | 2,984,345 | 10,426 |
| African American | 37.3% | 82.3% |
| White | 59.3% | 15.8% |
| Children under age 18 | 24.9% | 26.1% |
| Median Age | 36.3 | 33 |
| Total Housing Units | 1,284,794 | 4,060 |
| Median Household Income | $39,464 | $27,181 |
| Unemployment rate | 10.9% | 19.4% |
| Individuals Below the Poverty Line | 22.6% | 34% |
| High School Graduate or Higher | 81.9% | 76.4% |
Source: American Community Survey 5-Year Estimates, 2010–14.
Looking at this opportunity to revitalize Indianola and perhaps the region, the Delta Health Alliance along with political, business, and community leaders applied for the city to take part in this fledgling federal program.
In December 2012, Indianola leaders learned that the city would be just one of two rural grantees to get this chance. They now had five years and roughly $28 million to show that the program could work in a smaller, more isolated place. They had to make this opportunity count.
Aligning Schools
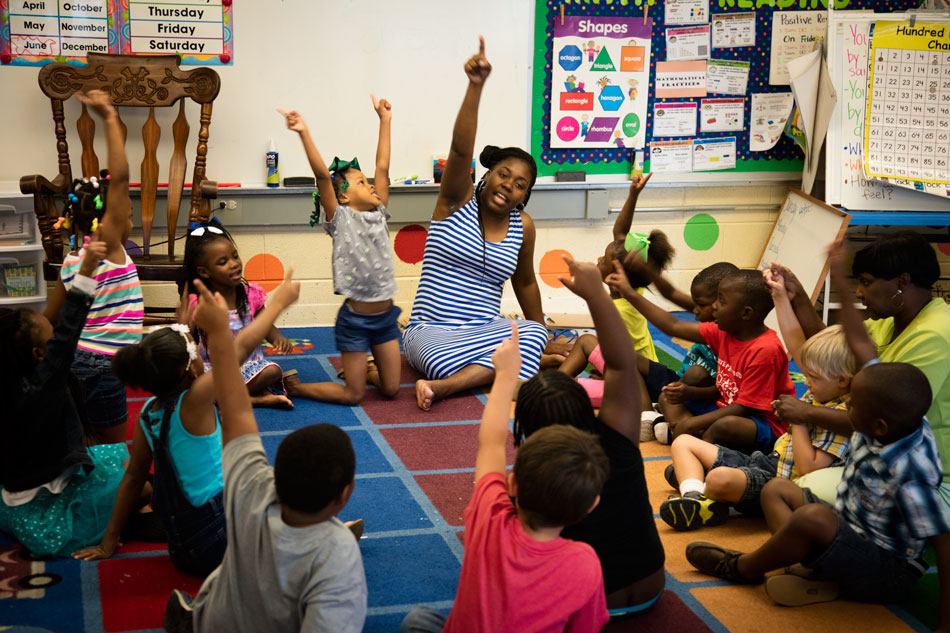
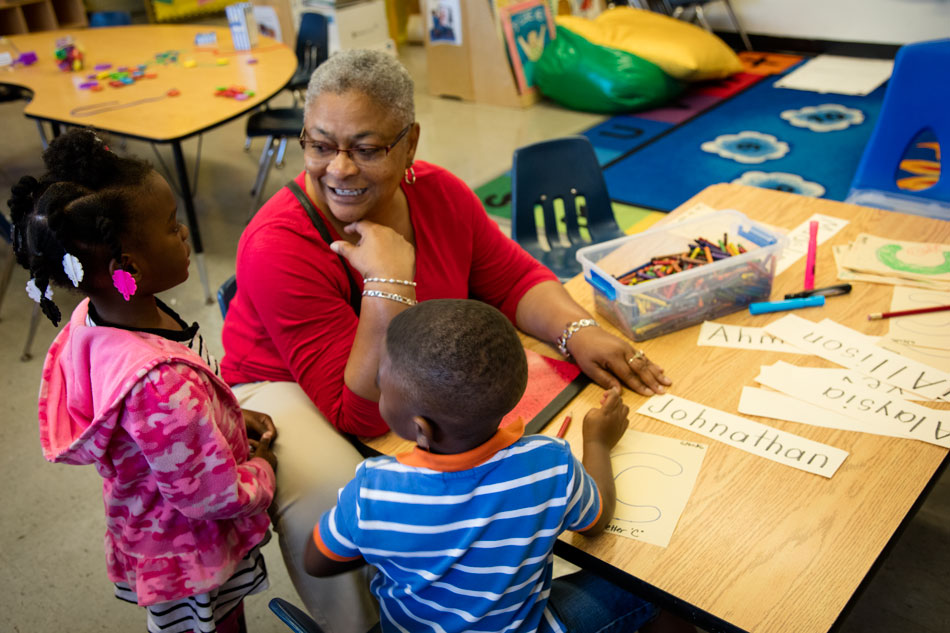
At Greenwood Marketplace, a grocery store roughly 29 miles east of Indianola, a cell phone buzzed in Shequite Johnson’s pocket. On the other end of the line was the principal of Lockard Elementary School; he needed Johnson to immediately leave work and come pick up her son. He was acting up again.
“My son was in the first grade and he did have some behavioral problems, but he wasn’t diagnosed with anything at the time,” said Johnson. “I would get calls at least three times a week. Eventually I was going to get fired.”
It was 2011—months before Indianola would win the implementation grant—and Johnson’s son was struggling in school. She would later learn that he has both a learning disability and a speech impediment, but nobody at Lockard was screening for those kinds of issues at the time. In fact, the teacher told Johnson she didn’t have the bandwidth to give her son special attention.
“Not being aware of my rights, I just bowed down,” said Johnson. “Okay, that’s fine.”
The organizers of the Indianola Promise Community (IPC) knew they had to do a better job of collecting data at all phases of child development so that prekindergarten programs could address problems early and deliver children to kindergarten prepared to learn.
Research shows that kindergarten readiness is a huge factor in subsequent academic success. To achieve that readiness, early-learning programs, such as Head Start, have to be performing well. And to obtain useful data about these prekindergarten programs’ performance, the systems for assessing children’s needs, collecting the data, and analyzing it need to be aligned and comparable at all school levels.
But transforming the public school system could not happen overnight, said Roshunda Sample, a project director at Delta Health Alliance, IPC’s sponsor organization. Rather, it would have to be a progressive development of systems, processes, and programs.
So in early 2013, the Delta Health Alliance hired a small team of researchers to build a new system that allows data to be collected, uploaded, and shared through a digital “passport” that would follow students from school to school and from birth to their high school graduation.
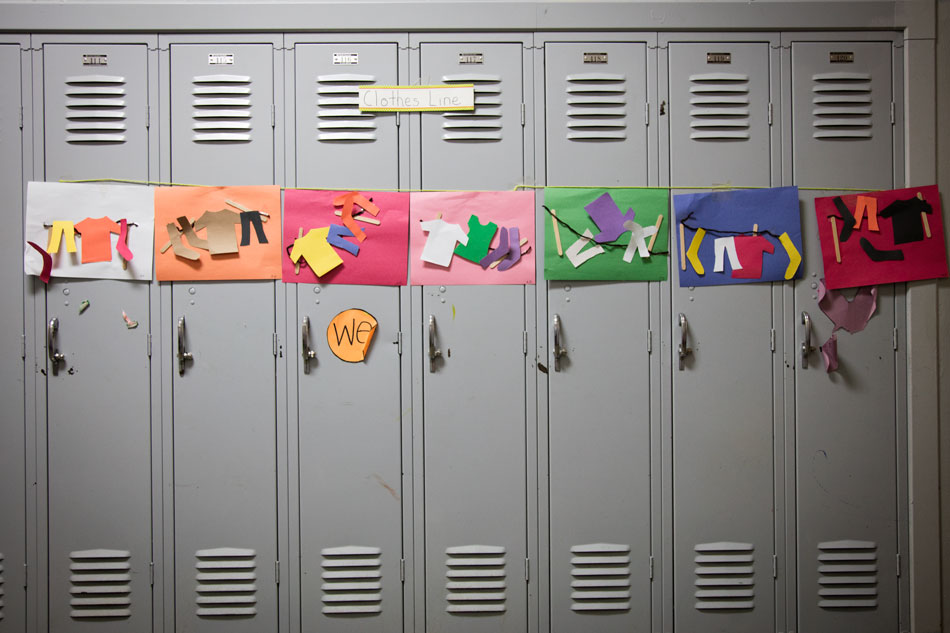
Starting with the summer education programs set up for children age 5 and under, the research team quickly realized that neither the Head Start camp, Small World, nor its school district counterpart, Promise School, were using aligned curriculum, assessment methods, or a shared system for documenting students’ progress.
Even more alarming was that they couldn’t tell if the camps were actually helping kids prepare for kindergarten. Since both Early Head Start and Head Start were already using the Creative Curriculum and the Ages and Stages assessment, IPC aligned the Indianola School District with these materials and methods.
IPC simultaneously implemented both a common performance measurement software, Scorecard, and a shared case-management database, Efforts to Outcomes, so that schools could log and share data as students progressed. By the fall of 2014, the system was working and kindergarten-readiness scores were already showing drastic improvement.
“When we started seeing higher-quality results and bigger impact was when we started using data and working with our partners in a more strategic way,” said Karin Scott, the research director at Delta Health Alliance.
- Karin Scott, research director, Delta Health Alliance
But IPC still had to account for children who were not enrolled in Early Head Start, which has a limited number of slots. So it modified an extant home-visiting program to work on kindergarten readiness. Through this program, paraprofessionals visited homes, connected with mothers, and showed them how to assess the development of their children’s motor, communication, hearing, and problem-solving skills. Those paraprofessionals then collected the assessments and uploaded the data, allowing children’s progress to be tracked from birth to their fifth birthday and providing early opportunities to catch and address problems.
Finally, between 2014 and 2015, private, home-based child care centers aligned their curriculum, assessment methods, and systems so that attending children were taught and tracked just like the other prekindergarten partners. In 2016 they modernized their facilities and kicked off efforts to ensure that all teachers are qualified and all centers are staffed to meet essential student-to-teacher ratios
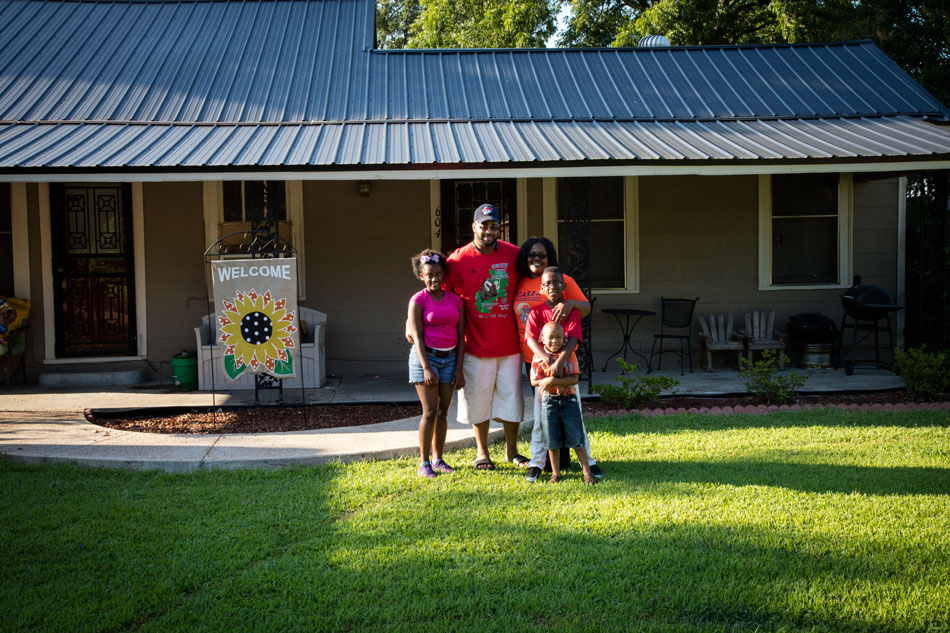
Shequite Johnson’s son will enter the fifth grade this fall. After he spent two years in a private school that Johnson couldn’t afford, she moved him back into the public school system, this time at Carver Elementary. He was still reading at a kindergarten level as he entered the third grade, but Johnson had gone through IPC’s parent leaders program and knew she could get more for her son.
She got him extra help from teachers and tutors, and they carefully tracked his progress and made adjustments along the way. When the year ended, he passed a milestone state literacy test. The year after that, he made the principal’s honor roll twice.
“It’s just amazing what a little push can do to a kid who everybody thinks is a failure,” said Johnson. “My son is a living example that kids can change with a little bit of support and [when] adults actually stand up for them.”
Aligning the Community
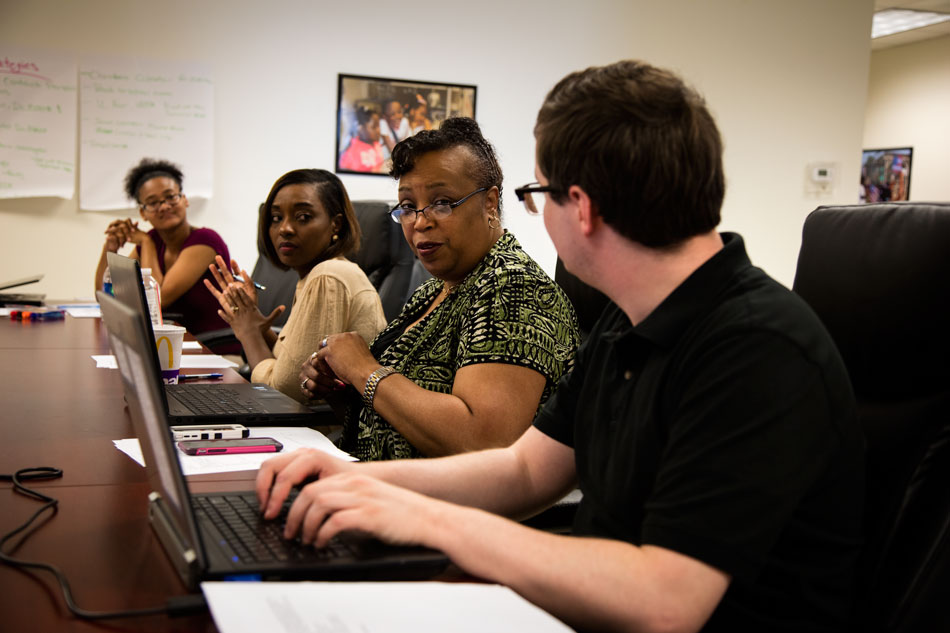
Dr. Deborah Moore sat in a meeting room in IPC’s downtown office. Seated with her around the long rectangular table were five colleagues gathered to conduct a monthly meeting to review the Imagination Library program, which mails free books to families with a child under age 5.
These meetings allow the team to review goals, see what the data say about progress, and strategize about how to better reach desired outcomes. During this particular meeting, the data delivered mixed news: program enrollments were up to 855 families in Indianola, but the number of community readings, where staff can enroll new families, declined by two in May.
So the staff reviewed factors that explained these trends, talked about where they could expand their outreach, and made action commitments to get better outcomes. But things didn’t always operate this smoothly.
Back in 2013, before these meetings existed, IPC’s data team realized that they didn’t have much buy-in from program staff and partner organizations.
The data team would come up with goals and performance measures, but because frontline staffers didn’t know why this information was requested, where it went, or how it was used, the data that came back were rarely high quality or frequent.
So at the end of 2013, IPC made the process more inclusive. The data and program teams jointly refined goals and performance measures for programs. And in January 2014, IPC decided to hold monthly accountability meetings.
Now frontline staffers can see how data are used to implement programs with fidelity and get the best outcomes for students and their families. Consequently, the quality and frequency of data collection improved, and IPC’s ability to gather actionable insights did too.
Building on that, IPC launched data coaching sessions in 2016 to help frontline staff learn how to better use data to make evidence-based choices in real time. IPC’s programs are now more informed and accountable to better educate children and support families.
“All our programs and strategies are connected back to a larger goal,” said Moore, who coordinates all of IPC’s community-based strategies and initiatives. “They have their own set of performance measures, and those performance measures are tracked on a monthly basis. It brings about a lot of accountability and it has really helped to move our work from just talk to action.”
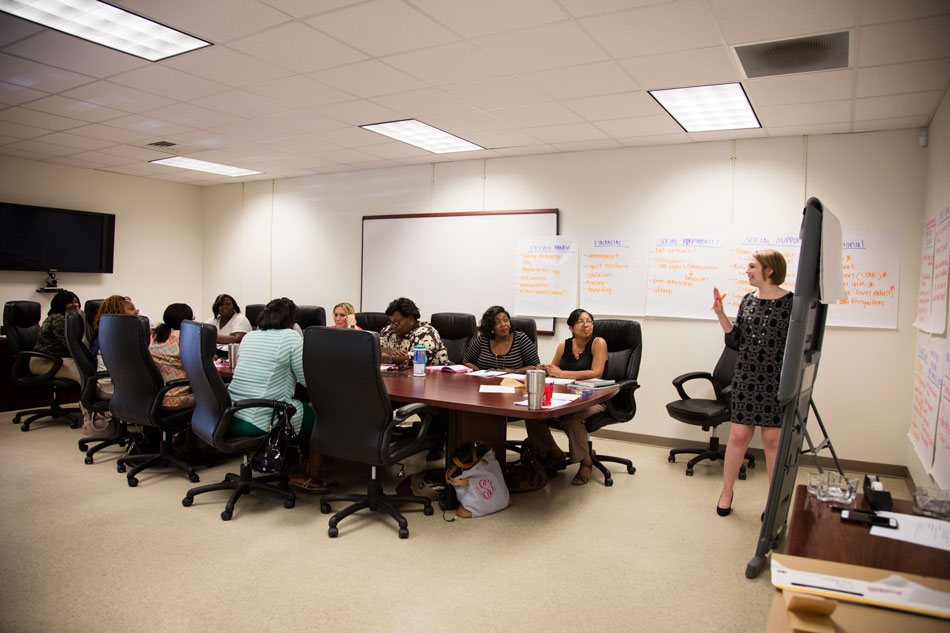
Overall, IPC has 10 articulated goals that are evaluated using 15 performance measures laid out by the Promise Neighborhoods program. From this structure sprang a total of 31 programs—including the Imagination Library—that simultaneously work toward reaching goals and allowing IPC to gauge progress.
The programs cover needs ranging from child literacy to financial literacy for parents and from teacher training to training parents as teachers. And home-visiting social workers, known as Links, help qualified, struggling families enroll in programs, such as Medicaid, federal food and cash assistance programs, or GED classes, that could help put them back on solid ground.
- Dr. Deborah Moore, associate vice president of community relations, Delta Health Alliance
Many of these assets already existed before IPC came to town. They just needed to be aligned to meet shared goals and made accessible with the help of frontline staffers.
Staying accountable and reporting progress back to the community is also integral to IPC’s strategy. That is accomplished through quarterly meetings with a community advisory board and biannual social events with food, artistic performances, and data presentations.
By doing all of the above, the Delta Health Alliance aims to create a more tightly knit Indianola.
“We’re actually empowering people through education,” Moore said. “[We’re] aligning contributions, aligning resources, and aligning people along the thought process. If we’re coming together around a shared result and we can understand our contribution … then together we can understand that we’re moving this work forward.”
Tomorrow’s Indianola
Things are getting better in Indianola. Since the Delta Health Alliance won a five-year grant to create and implement IPC, the data show significant progress, especially for children in early grades.
For example, 82 percent of IPC third graders passed the milestone state literacy test in 2016 compared with 79 percent last year. Notably, 59 percent of IPC students who could not pass the test in the fall were able to do so in the spring. That’s up 23 percentage points from the previous year.
Similarly, more kids are arriving in kindergarten prepared. Fifty-two percent of kindergartners were ready on day one in 2015 compared with just 25 percent in 2013. IPC kindergartners also outperformed their peers from other counties because they more rapidly adjusted to school and progressively improved on assessments.
Knowing that it will take time for these early results to work their way up into higher grade levels and with one year left in the grant, IPC staffers are hoping to win additional funding and keep it going.
“When we’re saying that we’re making a promise, the promise is not fulfilled after five years,” said Deborah Moore. “When you start looking at the changes that have to be made and the problems that have existed for generations and generations and generations, it takes a lot to change.”
Still, IPC knows that one day the funding will run dry and that the inertia created by the program will eventually have to sustain itself.
Although some IPC programs could cease when that happens, Delta Health Alliance believes that progress can be maintained if Indianola continues to focus on developing human capital and institutionalizing performance measurement and accountability systems.
“I think the culture has shifted here,” said Roshunda Sample. “We have people from all types of different backgrounds [working in our schools and programs]: education, art, humanities. Data is not really taught in those disciplines. [But] everybody talks data now.”
Building on this new culture, IPC is also beginning to eye some expanded work in Sunflower County. The Indianola, Drew, and Sunflower County school districts are now consolidated under one umbrella, led by one superintendent and guided by one school board. And these parties are now asking IPC to bring its know-how into their schools and programs.
Further, IPC already works with three child care centers outside of Indianola and will add four more this summer. And there are discussions about bringing the models used by Indianola’s summer education camps to surrounding areas.
“I think we’re better off than when we started,” said Sample. “We knew that from the Harlem model that it worked for them. I think we have proven that it can work in a rural setting as well.”