Connecticut’s current budget
Governor Ned Lamont released his
FY
2026-2027 budget proposal in February 2025 and gave the
state
of the state address in January 2025. The
FY
2026-2027 budget was enacted in June 2025.
Connecticut
enacted its
FY
2024-2025 biennial budget in June 2023. The budget reported general
fund spending of $22.1 billion in FY 2024, essentially flat from FY
2023, and $22.8 billion in FY 2025, an increase of 3 percent over FY
2024. Connecticut also approved a significant individual income tax cut
in calendar year
2023.
That tax reduction followed numerous tax cuts in
2022.
Under the
American
Rescue Plan, Connecticut received $2.8 billion in direct state
fiscal aid and $1.4 billion in local government aid from the federal
government. As of
January
2025, Connecticut had fully allocated its state ARP. States must
spend the funds by Dec. 31, 2026.
According to the
National
Association of State Budget Officers (NASBO), Connecticut’s total
expenditures in fiscal year FY 2025 were $42.6 billion, including
general funds, other state funds, bonds, and federal funds. NASBO
reported that total expenditures across all states in FY 2025 were $2.9
trillion, ranging from $5.4 billion in Wyoming to $413.8 billion in
California.
According to NASBO,
Connecticut’s recent expenditure totals (general fund spending/total
spending, including federal transfers) were:
- FY 2025: $23.4 billion/$45.3 billion
- FY 2024: $22.8 billion/$42.8 billion
- FY 2023: $22.2 billion/$42.6 billion
- FY 2022: $20.7 billion/$40.7 billion
- FY 2021: $19.4 billion/$37.6 billion
- FY 2020: $19.2 billion/$34.1 billion
- FY 2019: $19.2 billion/$34.4 billion
For more on Connecticut’s budget, see
Overview of Connecticut’s state and local expenditure and revenue
sources
Each state allocates spending and taxes differently among different
levels of governments, and local governments often administer programs
with state funds, so combined state and local government data show a
more complete picture of individual benefits and contributions when
comparing states.
Per the
US
Census Bureau, Connecticut’s combined state and local
direct
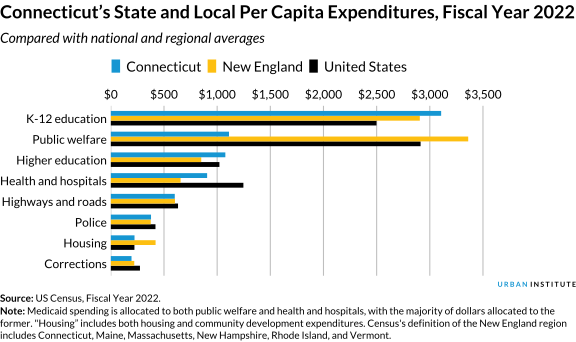
general expenditures were $44.0 billion in FY 2022 (the most recent
year census data were available), or $12,202 per capita. (Census data
exclude “business-like” activities such as utilities and transfers
between state and local governments.) National per capita direct general
expenditures were $12,083.
Connecticut’s largest spending areas per capita were
elementary
and secondary education ($3,107) and
public
welfare ($1,111). The Census Bureau includes most Medicaid spending
in public welfare but also allocates some of it to
public
hospitals. Per capita spending is useful for state comparisons but
is an
incomplete
metric because it doesn’t provide any information about a state’s
demographics, policy decisions, administrative procedures, or residents’
choices.
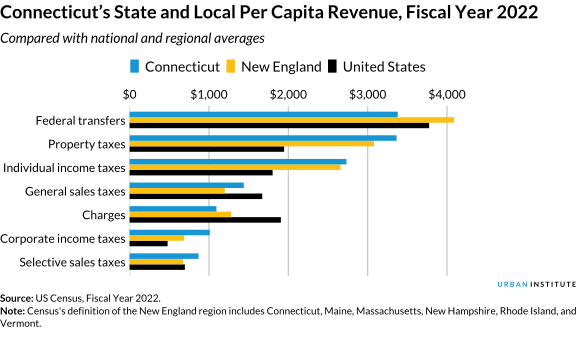
Connecticut’s combined state and local
general
revenues were $53.0 billion in FY 2022, or $14,676 per
capita. National per capita general revenues were $13,619. Connecticut
uses all major state and local taxes. After
federal
transfers, Connecticut’s largest sources of per capita revenue were
property
taxes ($3,364) and
individual
income taxes ($2,733).
Connecticut’s economic trends
Connecticut’s
per
capita income (per the Bureau of Economic Analysis) was $93,235 in
2024, ranking second among the states. It was above both the national
average of $72,425 and the New England regional average of $82,021. The
state’s
median
household income (five-year estimate) was $95,781 in 2024, ranking
eighth among the states and above the national average of $80,734.
Connecticut’s
poverty
rate was 10 percent in 2024 (five-year estimate), below the national
rate of 12.5 percent.
Although Connecticut’s averages tell a story about the entire state,
Connecticut is composed of diverse localities. For example, the city of
Hartford’s median household income was $46,411, and its poverty rate was
26.3 percent; the city of North Haven’s median household income was
$132,689, and its poverty rate was 4.1 percent.
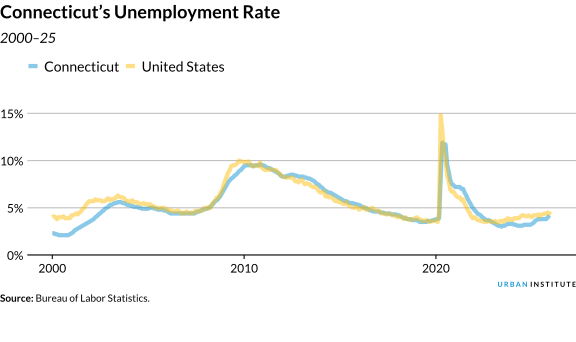
Connecticut’s
unemployment
rate was below the national rate for much of the 2000s, but it has
been slightly above the national average for most of the past
decade.
Unemployment rates (like other economic indicators) often
vary
significantly by race and ethnicity. In Connecticut, the average
unemployment rate in 2024 was 3.3 percent for white residents, 4.5
percent for Black residents, and 4.6 percent for Hispanic or Latino
residents.
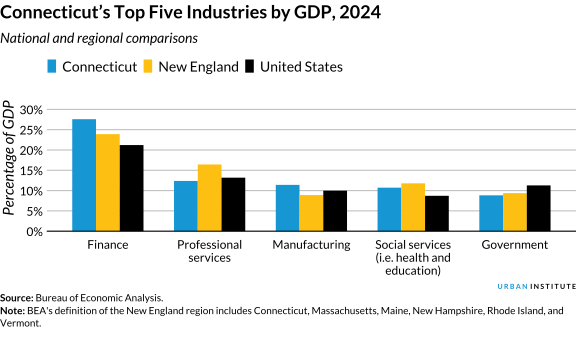
The major industries that contributed the most to Connecticut’s
gross
domestic product (GDP) in 2024 were finance, professional services,
manufacturing, social services (i.e. health and education), and
government. Connecticut’s finance industry is noticeably larger than the
national average and its regional average. However, according to
Connecticut’s
Office of Fiscal Analysis, the state’s finance industry has not
fully recovered from the Great Recession, though New York’s similarly
large finance industry has.
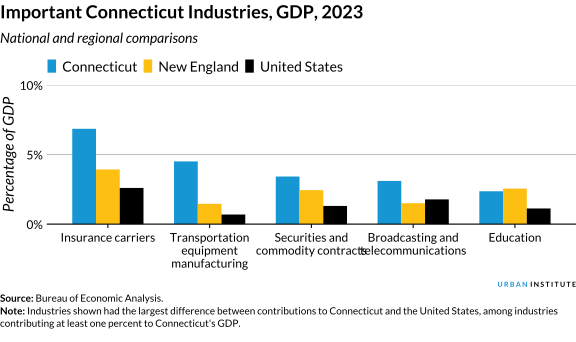
Looking at more specific industries, among those that accounted for
at least 1 percent of Connecticut’s GDP in 2023, insurance carriers
produced far more for the state than for the nation, contributing 6.9
percent to Connecticut’s GDP and 2.6 percent to the nation’s. Other
industries that overperformed in Connecticut relative to national
averages in 2023 were transportation equipment manufacturing, securities
and commodity contracts, broadcasting and telecommunications, and
education.
Connecticut’s politics
Governor Ned Lamont, a Democrat, was elected in 2022 with
56
percent of the vote. The next gubernatorial election is in 2026.
Democrats
control
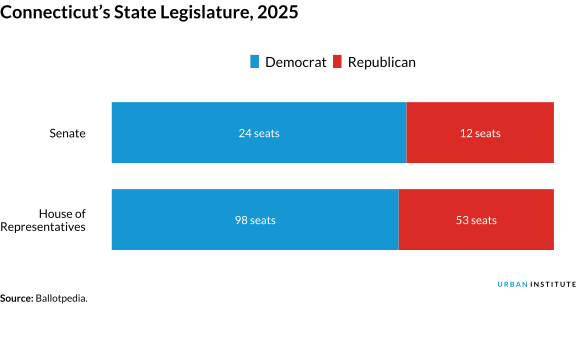
both the House of Representatives (98 Democrats to 53 Republicans)
and Senate (24 Democrats to 12 Republicans). Control of the governor’s
mansion and each house of the legislature gives Democrats a
trifecta
in Connecticut. The entire legislature is up for election in 2026
because both representatives and senators serve two-year terms.
Connecticut’s demographics
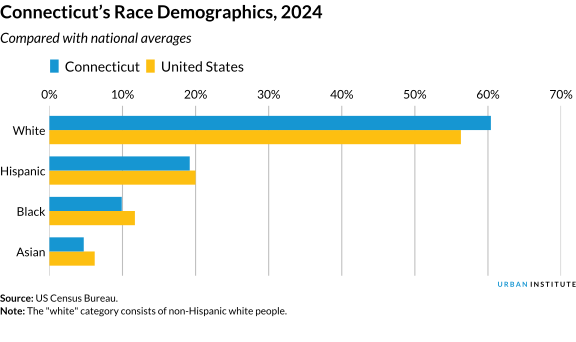
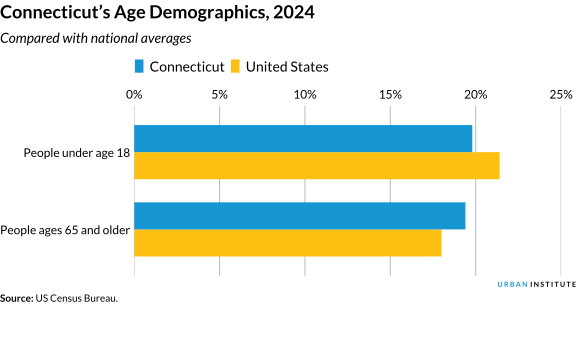
As of July 2024, Connecticut’s population was 3,675,069. That was up
2.7 percent from 2010. The state’s population growth rate was slower
than than the nation’s 9.9 percent growth over the same period. The
Urban Institute
estimates
the state’s population will increase 8 percent between 2010 and 2030,
less than the nation’s estimated growth rate of 16 percent.