 |
|
|||||||||||||||||||||||||||||||||||||||||||||||||||||||||||||||||||||||||||||||||||||||||||||||||||||||||||||||||||||||||||||||||||||||||||||||||||||||||||||||||||||||||||||||||||||||||||||||||||||||||||||||||||||||||||||||||||||||||||||||||||||||||||||||||||||||||||||||||||||||||||||||||||||||||||||||||||||||||||||||||||||||||||||||||||||||||||||||||||||||||||||||||||||||||||||||||||||||||||||||||||||||||||||||||||
Access and Affordability on the Verge of Health Reform
John Holahan, Stephen Zuckerman, Sharon Long, Dana Goin, Michael Karpman, and Ariel FogelJanuary 28, 2014
The most important coverage provisions of the Affordable Care Act (ACA) were implemented on January 1, 2014.1 The law gives states the option of expanding Medicaid to those with incomes up to 138 percent of the federal poverty level (FPL). It also establishes health insurance Marketplaces that make coverage purchasing easier for individuals and small businesses, and provides income-related subsidies for those with incomes between 138 percent and 400 percent of FPL.2 Finally, the ACA requires employers with more than 50 workers to contribute to health coverage for their employees or face a penalty (delayed until 2015) and imposes a mandate on individuals to obtain coverage if an affordable offer is available. Because of these provisions, the ACA is expected to expand insurance coverage, improve access to health care, and make health care more affordable.
In this brief, we assess the potential gains in access and affordability by examining differences among adults with different types of insurance (including being uninsured) before health reform implementation.
What We Did
This analysis draws on data collected in June–July 2013 from the Health Reform Monitoring Survey (HRMS), using a sample of nonelderly adults age 18–64. In addition to providing data on insurance coverage at a point in time, the HRMS has information on whether individuals had coverage over the prior year. Thus, respondents can be placed into three categories based on the type of their pre-reform insurance coverage:
We use those with private full-year coverage as a benchmark for comparison because their access to care and affordability of care is generally believed to be satisfactory. An important goal of health reform has been to ensure that others experience a similar level of access and affordability.
Those with employer-sponsored insurance (ESI) or directly purchased insurance have the highest incomes (see table 1). Those with public coverage have low incomes, with 95.2 percent having incomes below 400 percent of FPL. Those who were uninsured for all or part of the prior year have incomes that are also relatively low. The uninsured also tend to be younger, with 42.2 percent between age 18 and 30.
Those with private coverage, either ESI or directly purchased, are the healthiest group, with only 7.7 percent reporting fair or poor health. Those with public coverage are the least healthy, with 35.3 percent reporting fair or poor health. Those uninsured for all or part of the year are in the middle, with 18.6 percent reporting fair or poor health. To control for these and other observed differences in factors that can affect both health care access and affordability, we use multivariate regression models and present both unadjusted and regression-adjusted differences.3
The access questions ask respondents whether they have a usual source of care, had a routine checkup in the prior year, or had specific types of difficulty in obtaining care. We create an indicator that measures any difficulty obtaining care by combining responses regarding each type of difficulty accessing care (trouble finding a doctor or other health provider, trouble finding a doctor as a new patient, trouble finding a doctor who would accept insurance type, or trouble getting an appointment with a doctor). The affordability questions ask whether they experienced an unmet need because care was not affordable and whether they had problems paying medical bills.
What We Found
Privately insured adults generally have good access to care, but have some problems with affordability (table 2). Those with private full-year coverage are very likely to have a usual source of care (76.8 percent) and to have had a routine check-up in the prior year (67.2 percent). Only 16.7 percent of the privately insured experienced any difficulty obtaining care in the prior year. On measures of affordability, 24.8 percent of the private full-year insured report one or more unmet needs for care because of affordability—14.7 percent for medical care, 17.5 percent for dental care, and 11.7 percent for prescription drugs. Of the same group, 16.0 percent report problems paying medical bills.
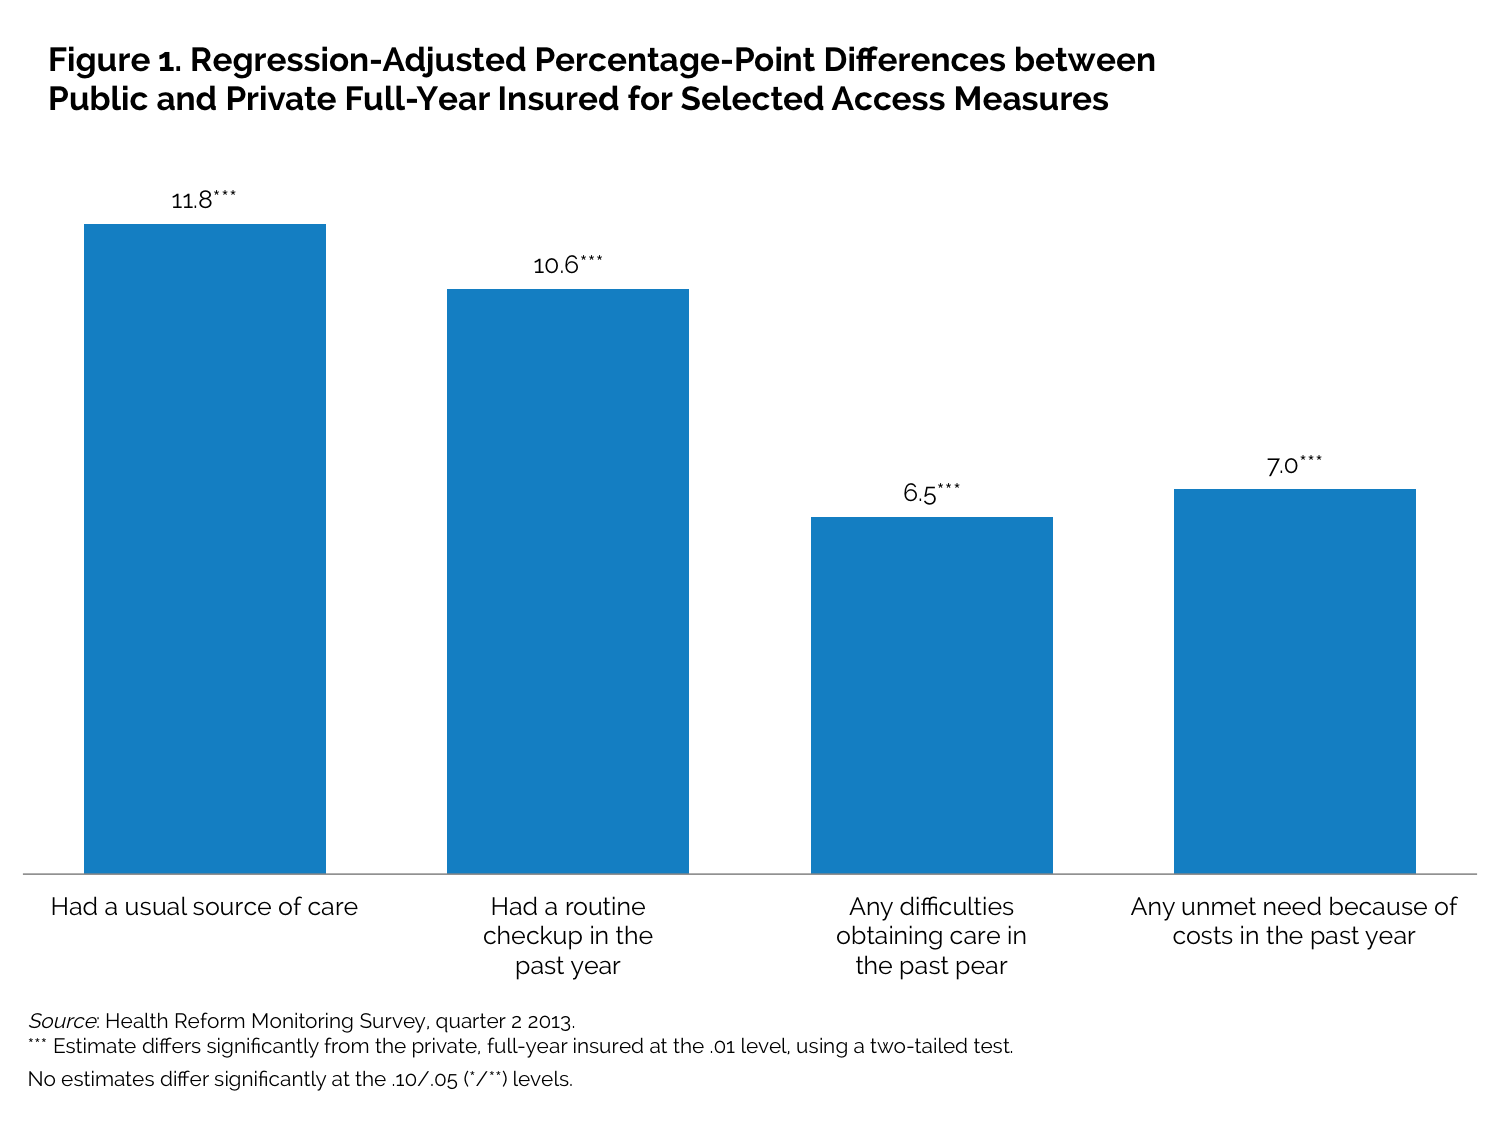
Publicly insured adults fare well in many, but not all, measures of access and affordability. Compared with the privately insured, those with public full-year coverage are more likely to have a usual source of care (83.3 percent versus 76.8 percent) or to have had a routine checkup in the prior year (77.5 percent versus 67.2 percent). However, they are also far more likely to report difficulty in obtaining care (29.4 percent versus 16.7 percent) and finding a doctor (8.5 percent versus 3.5 percent) in the prior year, including more trouble finding a doctor who would accept their insurance (16.2 percent versus 4.9 percent). The regression-adjusted differences in these measures remain significant, but are slightly smaller in magnitude (figure 1).
Adults with public full-year coverage are twice as likely as the privately insured to report some unmet needs for care because of costs, though regression-adjusted differences in unmet need are only significant for unmet dental care needs. Those with public coverage are more likely to report problems paying medical bills, but after regression-adjustment that controls for differences in income and health status across the pre-reform insurance groups (among other factors), we find that those with public coverage are less likely to report problems paying medical bills than the privately insured.
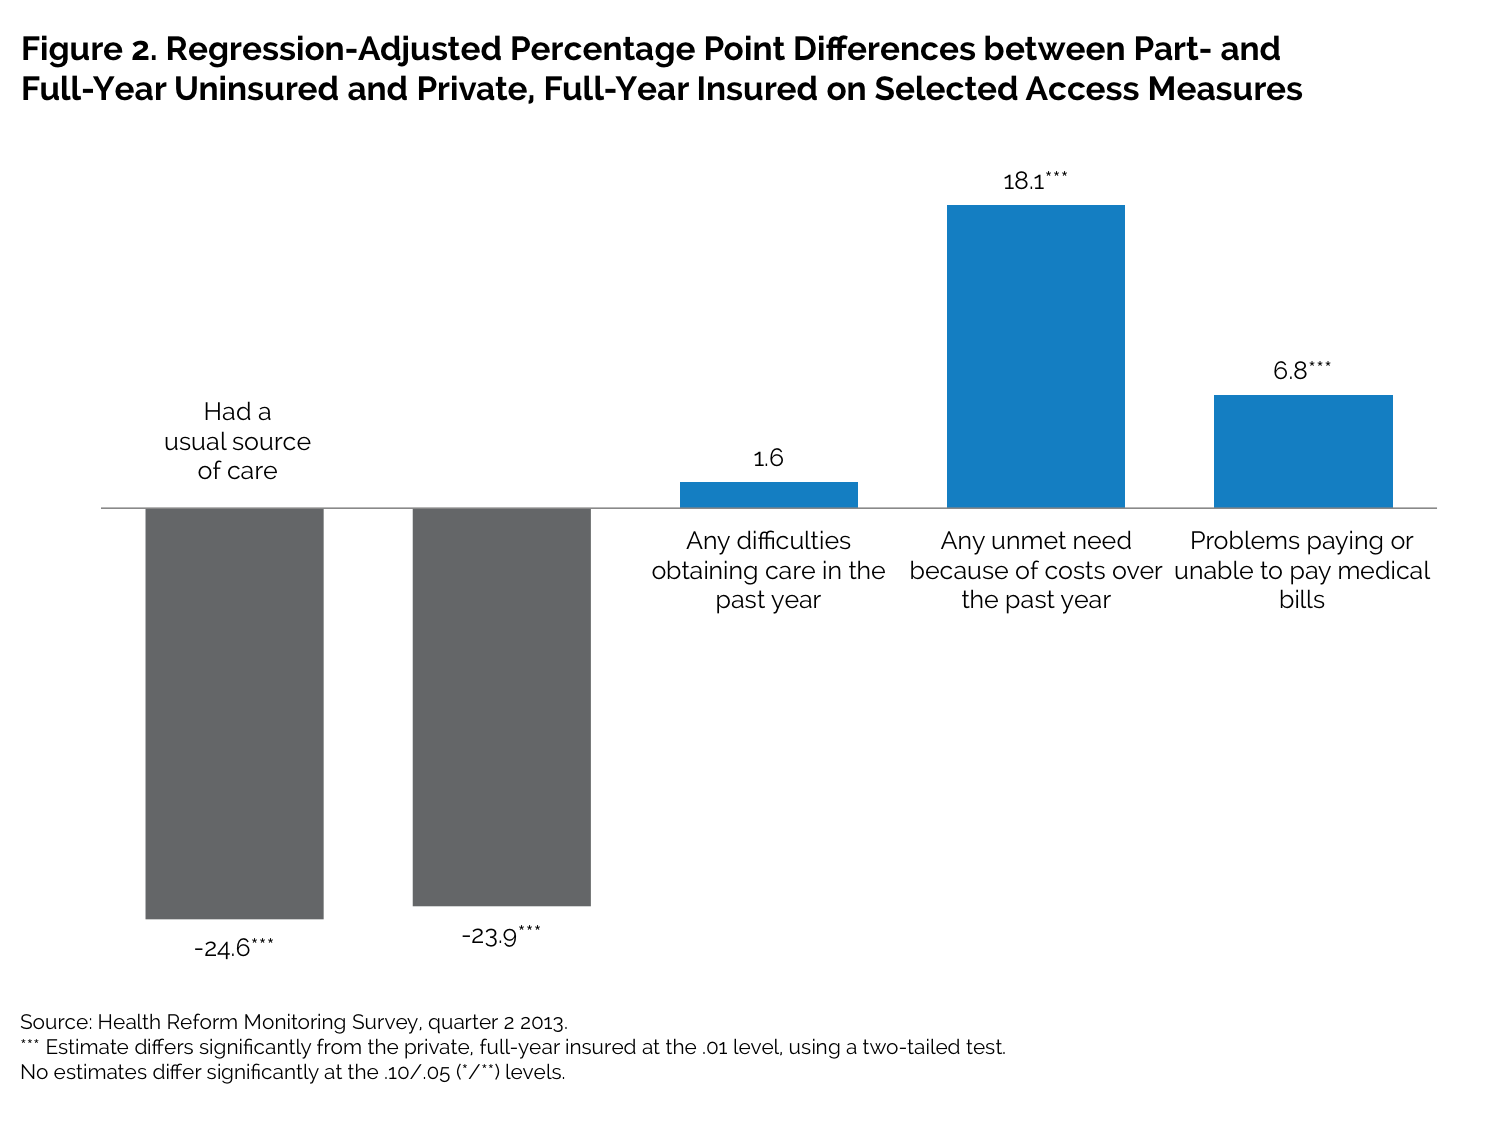
Those uninsured for all or part of the prior year report significant problems with most measures of access and affordability. Those who were uninsured for all or part of the prior year are much less likely than those with private full-year coverage to have a usual source of care (46.6 percent versus 76.8 percent) or to have had a routine check-up (39.3 percent versus 67.2 percent). They are also more likely to report having difficulty obtaining care in the past year (22.1 percent versus 16.7 percent) and report higher levels of three out of the four specific types of difficulty in obtaining care that we measured—differences that remain significant in the regression-adjusted results (figure 2).
As with the access measures, those who were uninsured for all or part of the prior year are much more likely to report one or more unmet needs because of affordability than those with private coverage (54.5 percent versus 24.8 percent) and to report specific types of unmet need. The uninsured are also much more likely to report problems paying medical bills that the privately insured (34.0 percent versus 16.0 percent). All these differences also remain significant in the regression-adjusted results.
What It Means
Those with public coverage fared reasonably well on several measures of access to care, but still have some difficulty getting appointments with doctors. They are more likely than those with private coverage to report unmet affordability needs, but only for dental and mental health care (after regression adjustment). This bodes well for those who will gain Medicaid coverage under the ACA.
Those who were uninsured for all or part of the prior year report substantially greater problems with access and affordability, with significant regression-adjusted differences for all measures. This also bodes well for the future, suggesting that the problems of the uninsured should be greatly reduced as they gain coverage under the ACA.
About the Series
This brief is part of a series drawing on the Health Reform Monitoring Survey (HRMS), a quarterly survey of the nonelderly population that is exploring the value of cutting-edge Internet-based survey methods to monitor the Affordable Care Act (ACA) before data from federal government surveys are available. The briefs provide information on health insurance coverage, access to and use of health care, health care affordability, and self-reported health status, as well as timely data on important implementation issues under the ACA. Funding for the core HRMS is provided by the Robert Wood Johnson Foundation, the Ford Foundation, and the Urban Institute.
For more information on the HRMS and for other briefs in this series, visit www.urban.org/hrms.
About the Authors
John Holahan is an Institute fellow, Stephen Zuckerman is codirector and senior fellow, and Sharon K. Long is a senior fellow in the Urban Institute’s Health Policy Center. Dana Goin, Michael Karpman, and Ariel Fogel are research associates in the Health Policy Center.
Note 1 Open enrollment launched on October 1, 2013, but actual coverage began on January 1, 2014. 2 If a state does not adopt the Medicaid expansion, income-related subsidies begin at 100 percent of FPL. 3 The regressions control for age, gender, race and ethnicity, health status, education, marital status, family income, home ownership, and an indicator of residence in a metropolitan area. The regression-adjusted differences should not be interpreted as the impact of having one type of insurance as opposed to another (or of having no insurance). There may be unmeasured differences between insurance groups that affect who has a particular type of insurance and relate to access and affordability. |
||||||||||||||||||||||||||||||||||||||||||||||||||||||||||||||||||||||||||||||||||||||||||||||||||||||||||||||||||||||||||||||||||||||||||||||||||||||||||||||||||||||||||||||||||||||||||||||||||||||||||||||||||||||||||||||||||||||||||||||||||||||||||||||||||||||||||||||||||||||||||||||||||||||||||||||||||||||||||||||||||||||||||||||||||||||||||||||||||||||||||||||||||||||||||||||||||||||||||||||||||||||||||||||||||||

 |
 |