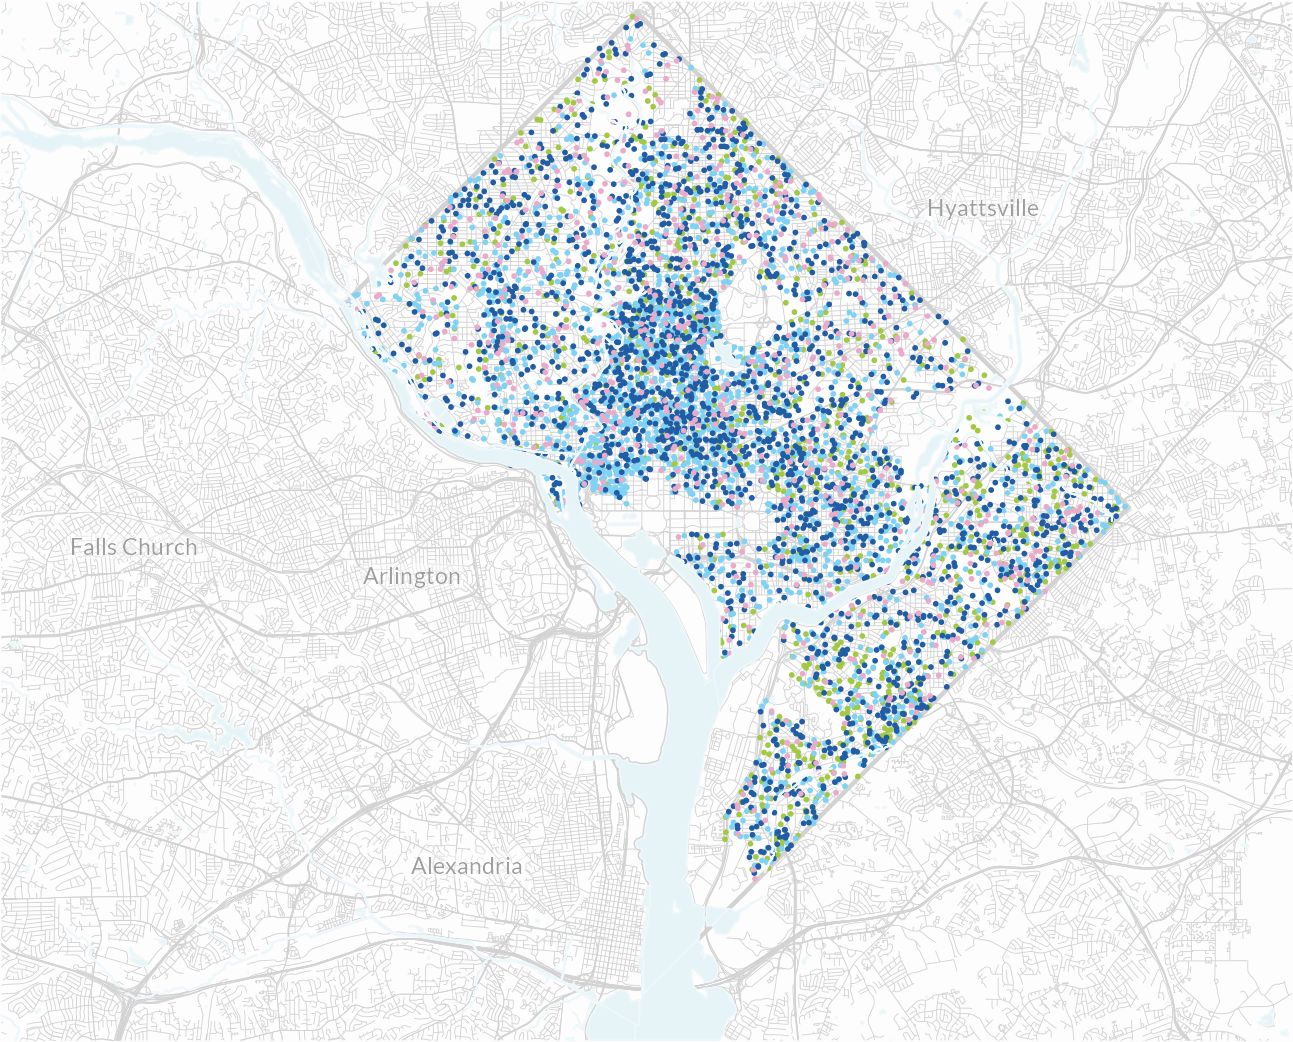
2010
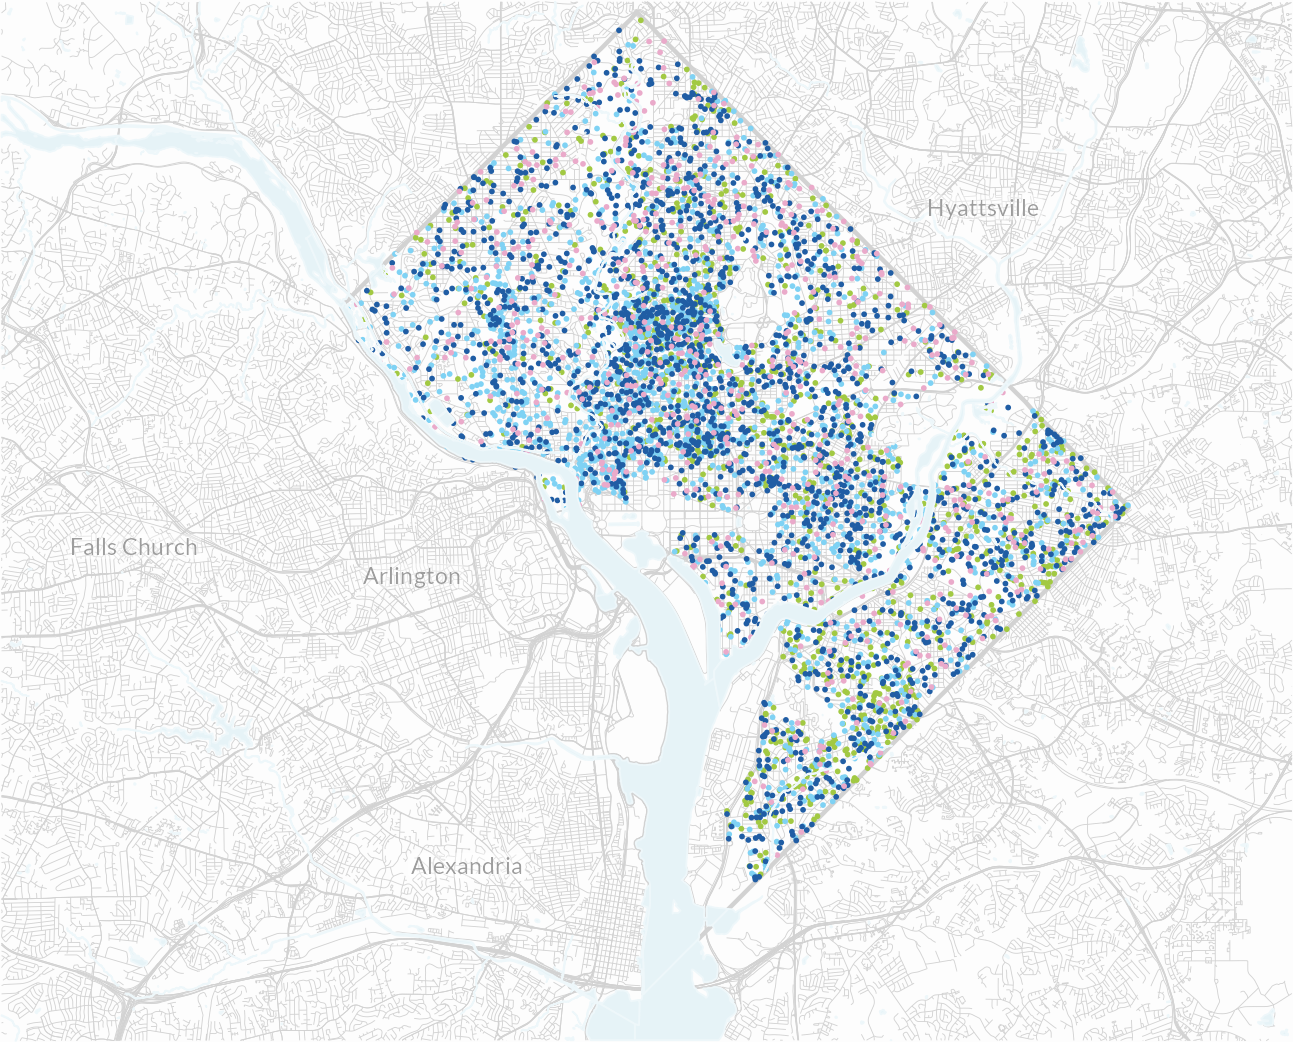
2000

Washington, DC, residents don't need census data to tell them what's obvious in their neighborhoods: the city is changing dramatically. But numbers can give us context. They can show us how shifts in population are reshaping the city and can help us prepare for changes to come.
In this series, we'll home in on changes from the past decade—2000 to 2010—when DC's population began growing again for the first time in 50 years. In this chapter, we look at demographic change, drilling down to wards and neighborhoods. Later, we'll explore changes in housing, crime, education, and more, using data from NeighborhoodInfo DC to tell the story of our changing city.

Looking at how DC wards have changed over the past 30 years shows how different the most recent decade has been. Wards 5, 7, and 8 lost a significant number of residents from 1980 to 2000, before the trend turned around.
Ward 2 had the biggest growth spurt of the decade, adding 13,000 people, particularly in Shaw and Logan Circle. The H Street NE Corridor and NoMa, areas still undergoing rapid transformation, helped make Ward 6 the second-fastest growing ward with more than 8,500 new residents from 2000 to 2010. In previous decades, Ward 6 had steadily lost residents.
DC is not a particularly dense city compared with other large cities; it's not even in the top 125 US cities by density. In 2010, about 9,900 people per square mile lived within DC's borders, slightly up from 9,400 in 2000. For comparison, New York City is much more crowded, with 26,000 people per square mile.
While some areas near Metro stops increased in density over the decade, populations fell near some Red Line stops in Ward 5.
Foggy Bottom is the densest neighborhood in DC. With 37,000 people per square mile, it's close in density to Brooklyn.
Decennial census data tabulated by NeighborhoodInfo DC.
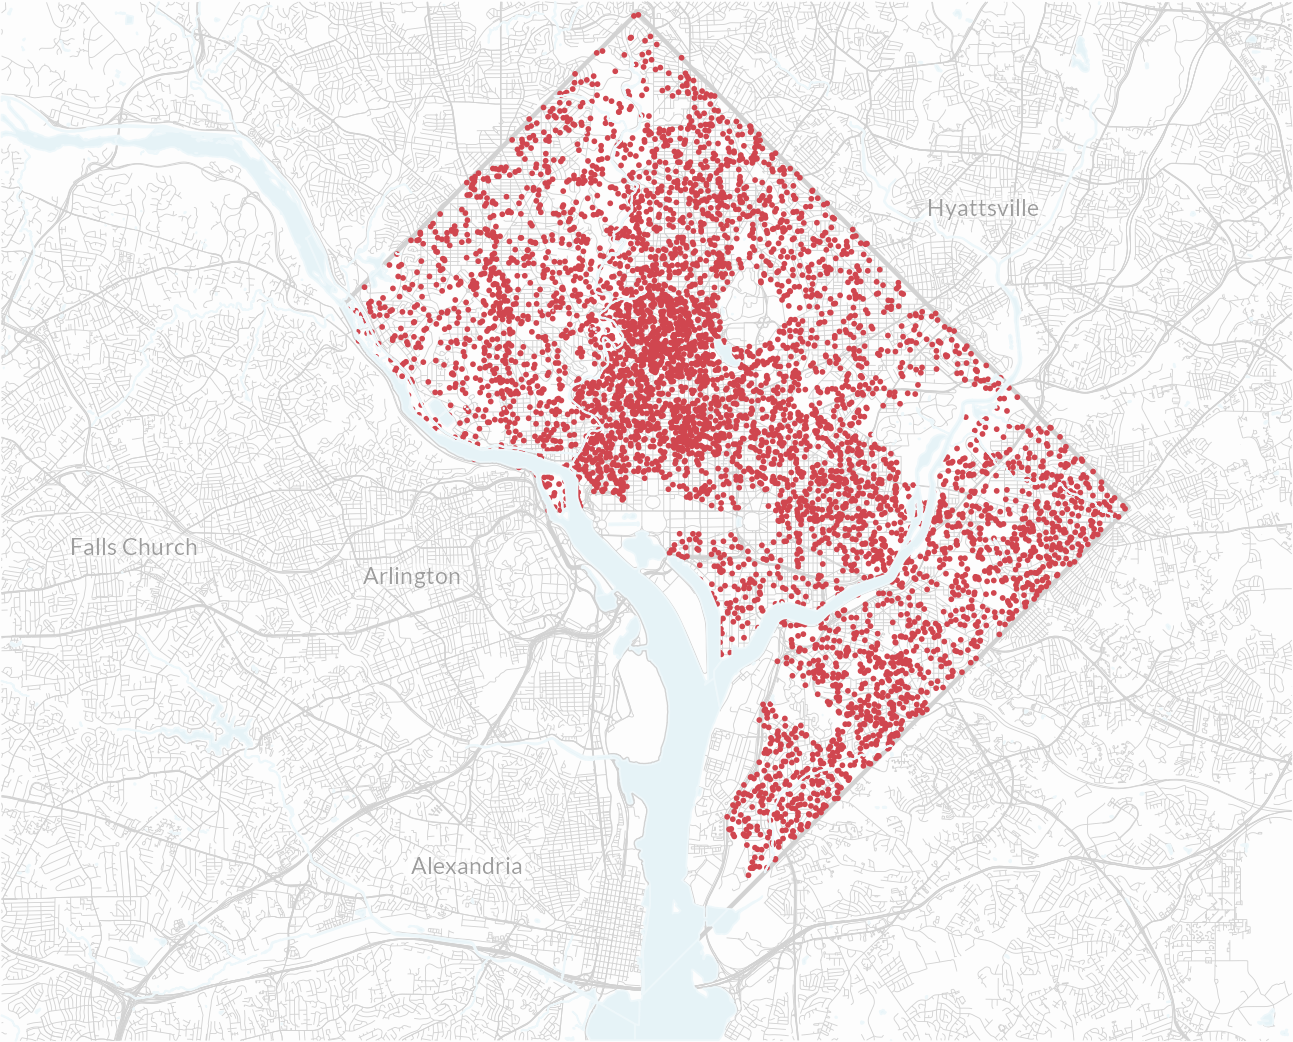
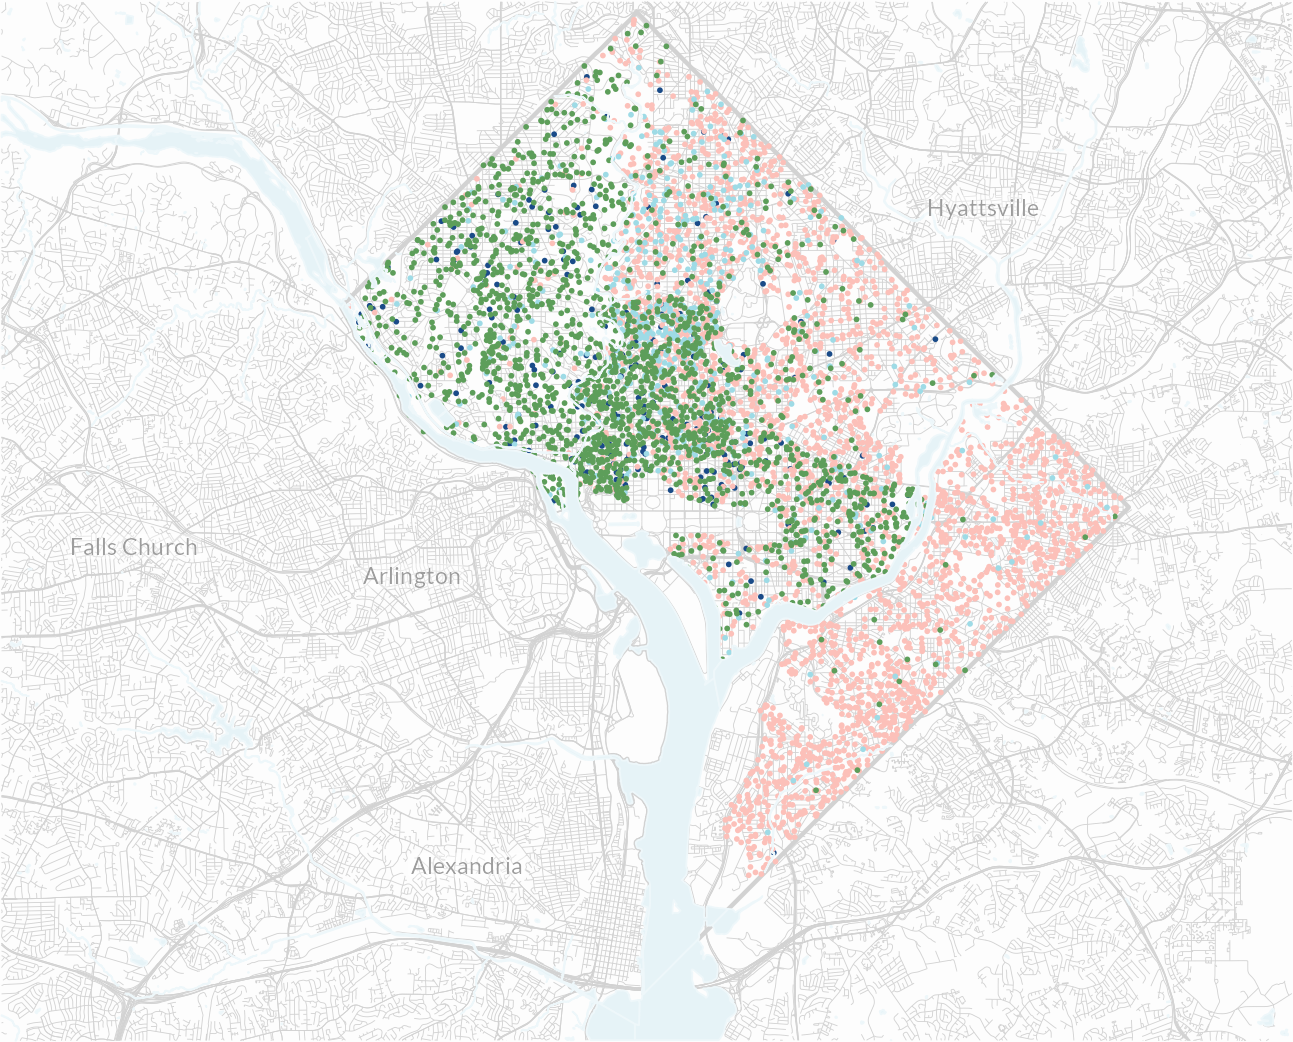
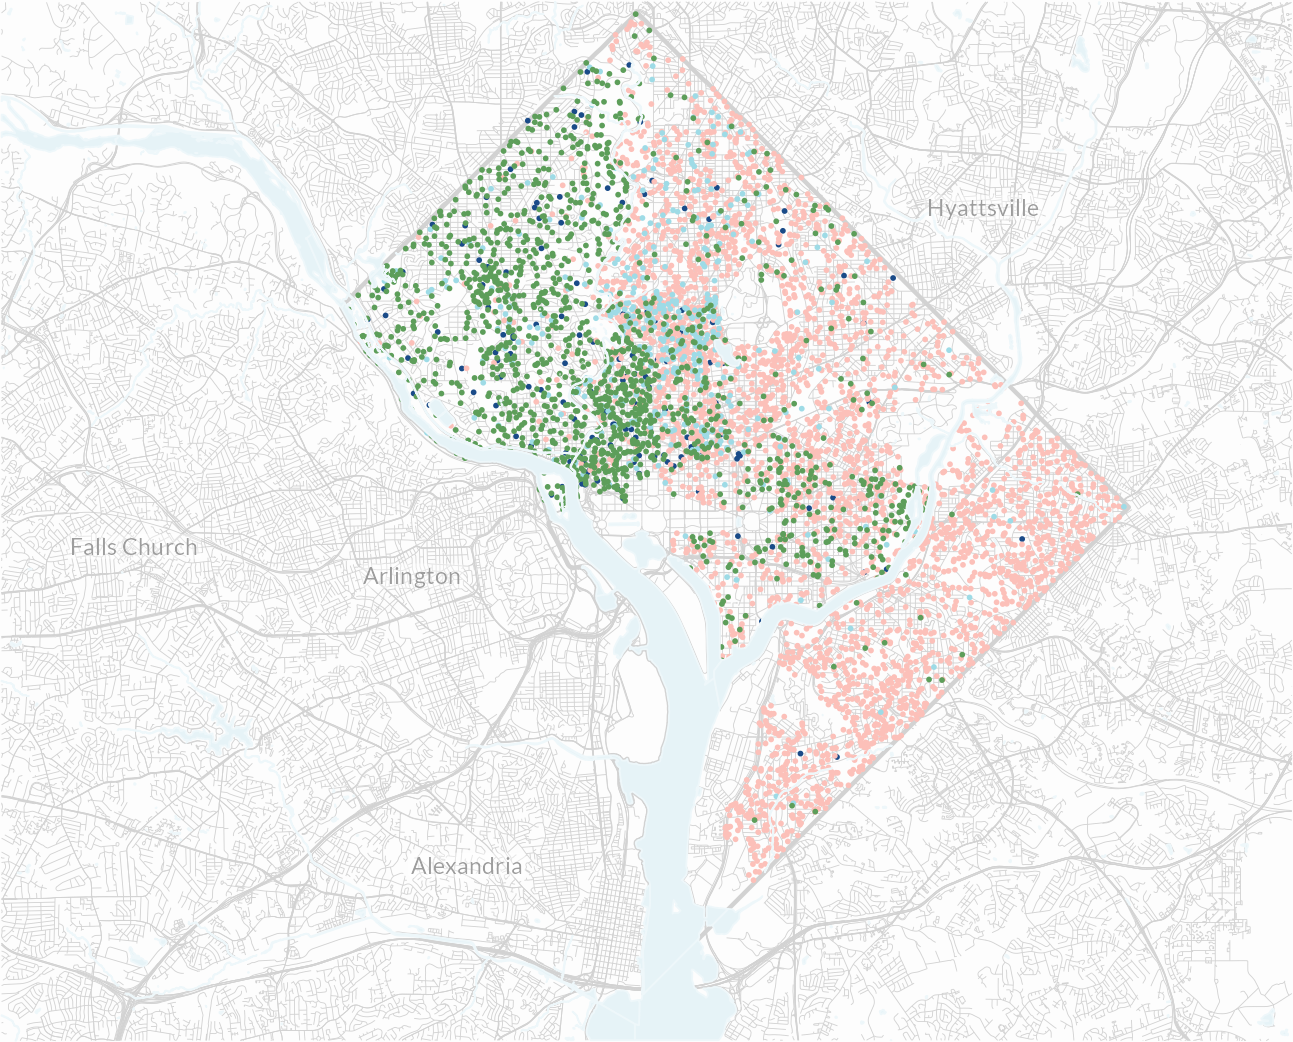
DC is one of the few cities where growth is being driven by an influx of whites, rather than by Latinos, Asians, or immigrants.
DC's black population eclipsed its white population in the 1950s, and the city has been majority African American since. But that majority has been steadily shrinking since the 1980s, even before the city's recent turnaround. In 1980, 70 percent of DC's population was black; that share fell to 61 percent in 2000 and 51 percent by 2010.
The black population declined in 14 of 39 neighborhood clusters from 2000 to 2010. About 6,700 fewer African Americans live in the Columbia Heights–Mt. Pleasant area. Petworth–Brightwood Park and Union Station–Stanton Park each lost about 5,000 to 6,000 black residents. A few areas gained black residents, such as Woodland and Ft. Stanton in Southeast DC.
What has been different in recent years is that, in addition to blacks moving out as they have done in prior decades, whites and others are now moving in and are more likely to stay. Looking at the maps, you can see that the areas where blacks moved out and the areas where whites moved in are roughly the same. Columbia Heights–Mt. Pleasant gained 8,300 white residents, while about 6,500 whites moved into the Union Station area. White residents largely avoided neighborhoods east of the Anacostia River.
Meanwhile, the Latino population also grew, but became more dispersed. Columbia Heights and Mt. Pleasant are still home to the biggest Latino population in the city (12,600 in 2010), but their numbers aren't as concentrated as before. Latinos are moving into other neighborhoods, such as Brightwood, Petworth, Takoma, Fort Totten, and some areas east of the river.
Asians and whites tend to settle into the same neighborhoods in Northwest DC, though Asian immigrants in this region are more likely to move to the suburbs. The Asian share of DC's population inched up from 3 percent in 2000 to 4.2 percent in 2010.
Decennial census data tabulated by NeighborhoodInfo DC.
The country is aging, but DC is getting younger. From 2000 to 2010, the city's 18- to 34-year old population grew by roughly 37,000, and now makes up 35 percent of the population. (Millennials make up only 23 percent of the US population as a whole.) These young adults are driving DC's population growth, and their numbers are rising in nearly every part of the city.
About 14,000 fewer children under 18 now live in the District. DC Public Schools is planning for a turnaround based on the city's recent baby boom, but it's not yet clear if babies born in DC will stay in DC through middle and high school.
The areas that grew the most also lost the most children, including Columbia Heights–Mt. Pleasant, which had 3,200 fewer kids by 2010, and Shaw–Logan Circle, with 1,000 fewer kids despite an overall increase of 3,000 people. Families with children likely moved out to the suburbs while younger, childless newcomers moved in. Neighborhoods in upper Northwest and Capitol Hill gained some children.
DC gained about 8,000 more adults age 35 to 64. Many left the upper Northwest and ventured further east, where homes are more affordable. Mt. Vernon Square, Shaw, and Logan Circle were popular neighborhoods for this age group, as were Ivy City, Trinidad, Congress Heights, and LeDroit Park.
The elderly population fell by about 1,000 in DC overall but grew in a few neighborhoods, including Congress Heights and the high-income neighborhoods of Spring Valley and Foxhall.
Decennial census data tabulated by NeighborhoodInfo DC.
Columbia Heights and Mt. Pleasant are prime examples of neighborhoods that have seen major demographic changes from 2000 to 2010. The total population went up from 46,779 in 2000 to 47,378 in 2010. The share of black and Hispanic residents fell, as did the share of children.
DC has a challenge ahead.
The nation's capital is growing again, but that growth is concentrated in a few areas, driving up home prices in places like Columbia Heights, Shaw, Logan Circle, the Waterfront, and Capitol Hill.
Once-neglected neighborhoods, scarred by riots, are now recovering and even thriving—but revitalization can drive out long-time residents. How can we make sure they have the opportunity to stay and benefit from the city's new prosperity? Millennials are reshaping DC, but will they remain as economic growth returns to other parts of the country? And can DC grow with them to meet their needs as they start having families and buying homes?
Figuring out how to manage and plan for change begins with determining our goals. If we want diverse neighborhoods and communities, we must consider what it really takes to get there.