
Introduction
Public spending on children is an investment in our nation’s future, benefitting both children and society at large. When children have what they need to live healthy and productive lives, they are better able to fulfill their potential as adults.
Each year, the Urban Institute produces the Kids’ Share report to help policymakers and advocates understand how public funds are spent on children from birth through age 18.
The report analyzes trends in spending and tax expenditures on children by level of government and compares federal spending on children to other categories of the federal budget. We also look at spending as a percentage of the economy (share of GDP), as a percentage of the federal budget, and in per-capita terms. To enable comparisons over time, we present all expenditures in inflation-adjusted 2024 dollars.
This year’s report presents federal spending on kids for fiscal year 2024 (October 1, 2023 to September 30, 2024). We include historical spending levels and future spending projections that account for recent legislative changes to federal spending, including the One Big Beautiful Bill Act.
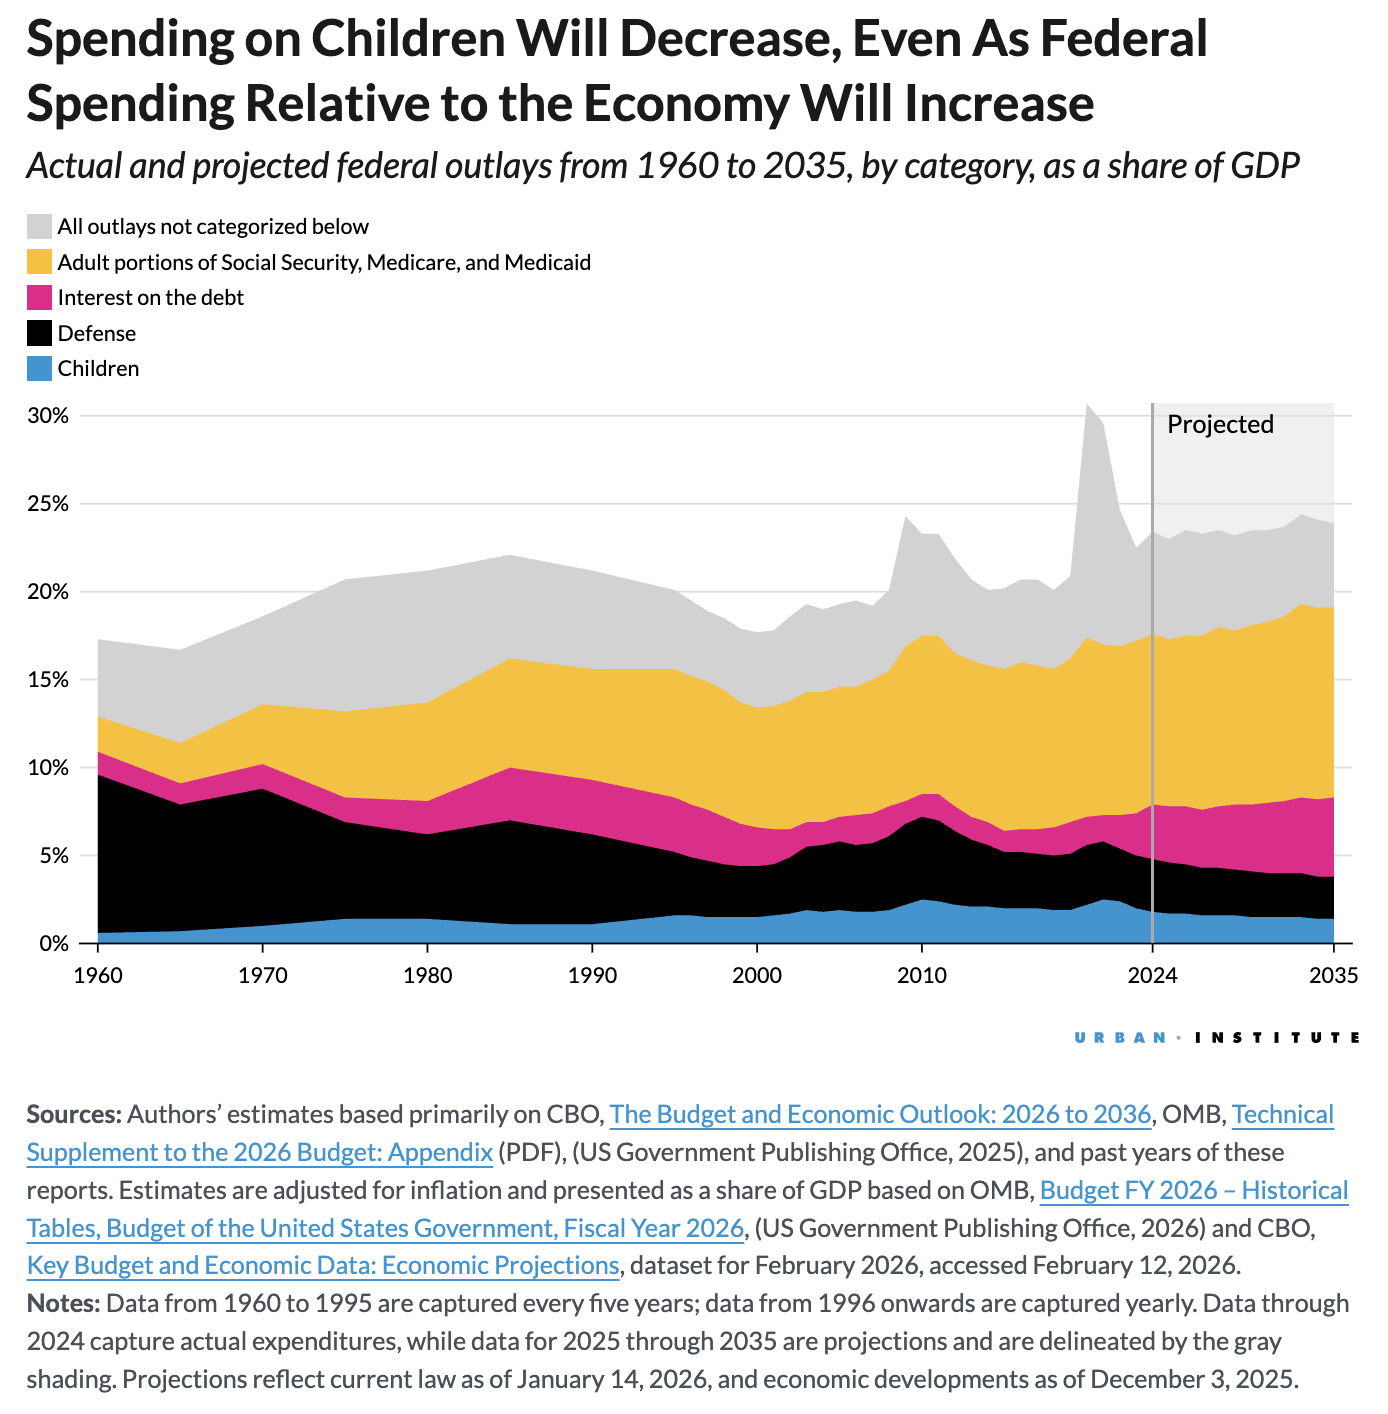
We find that overall federal spending on children relative to the economy and other federal spending is on the decline. Over the next decade, all categories of spending on children are projected to fall relative to the size of the economy. In other words, even as the economic pie gets bigger, the children’s slice will get smaller.
How our government spends money, and who benefits from that spending, reflects our national priorities. Understanding spending on children and how it compares to other categories of spending can help inform policymakers at all levels of government as they consider and evaluate legislation that affects children.
Key Takeaways
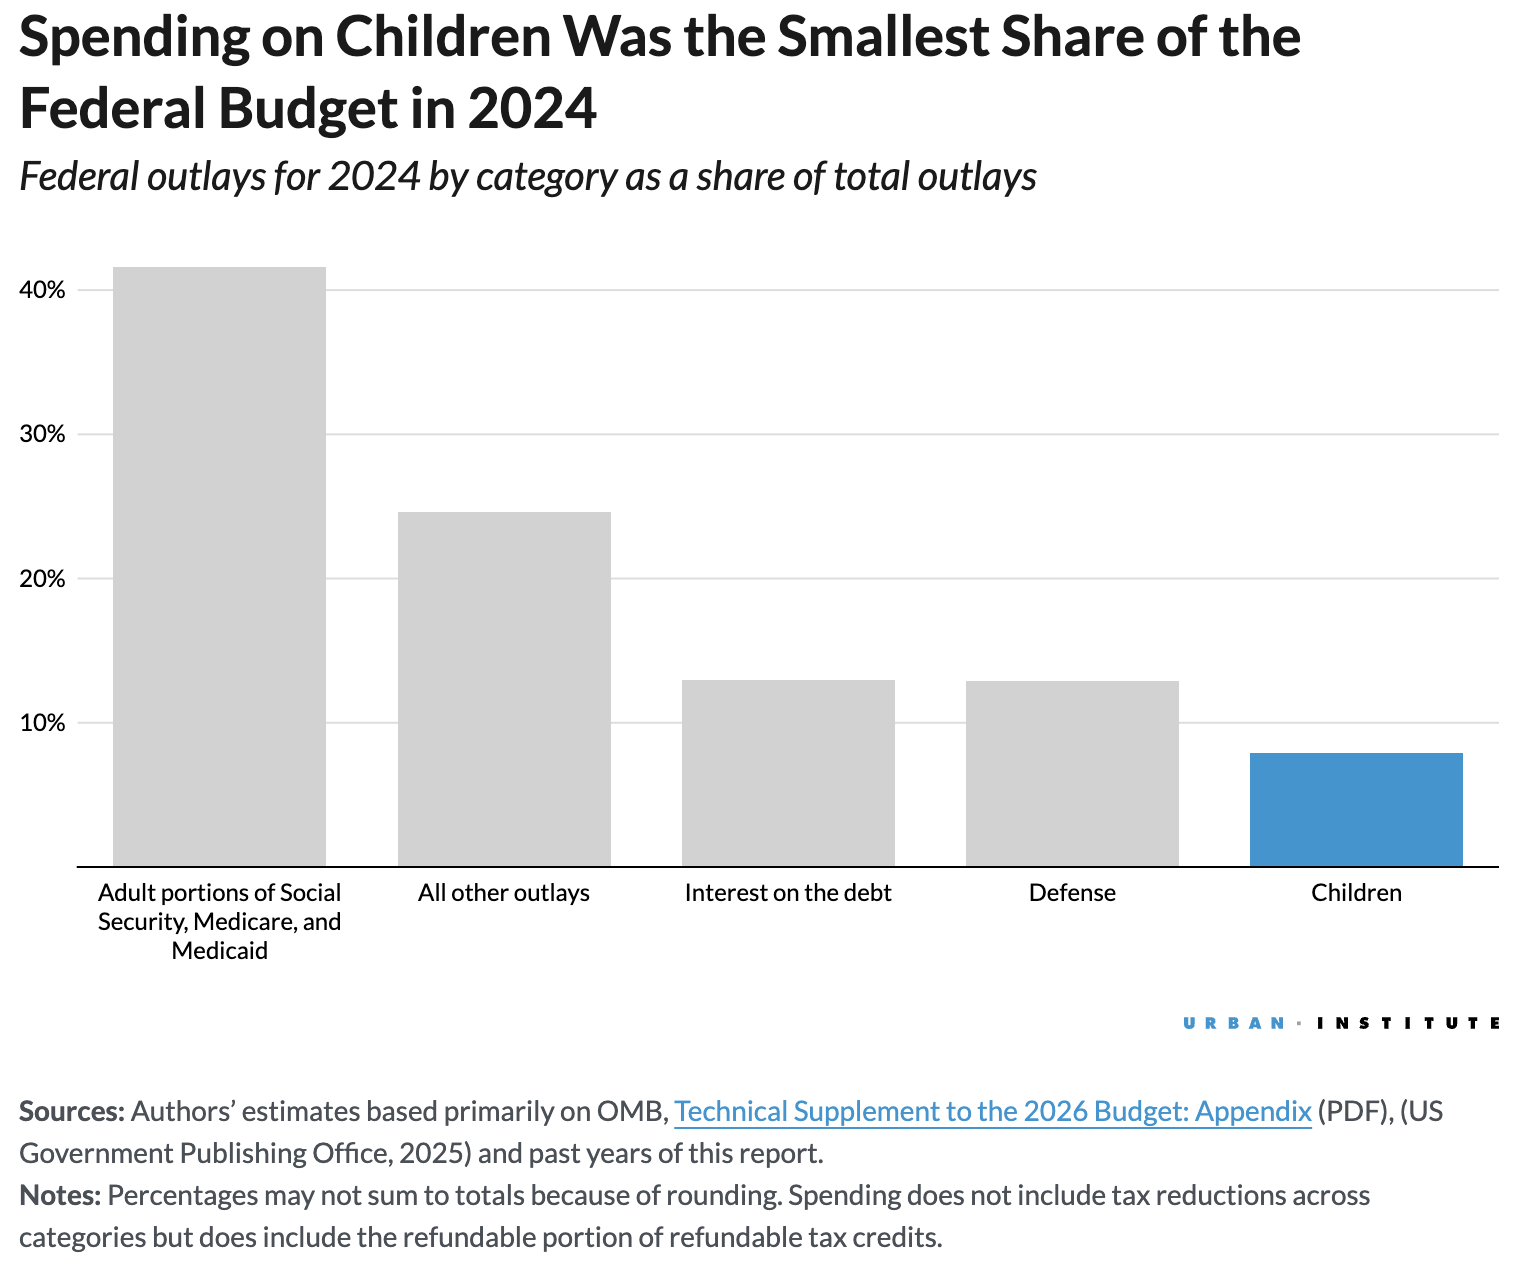
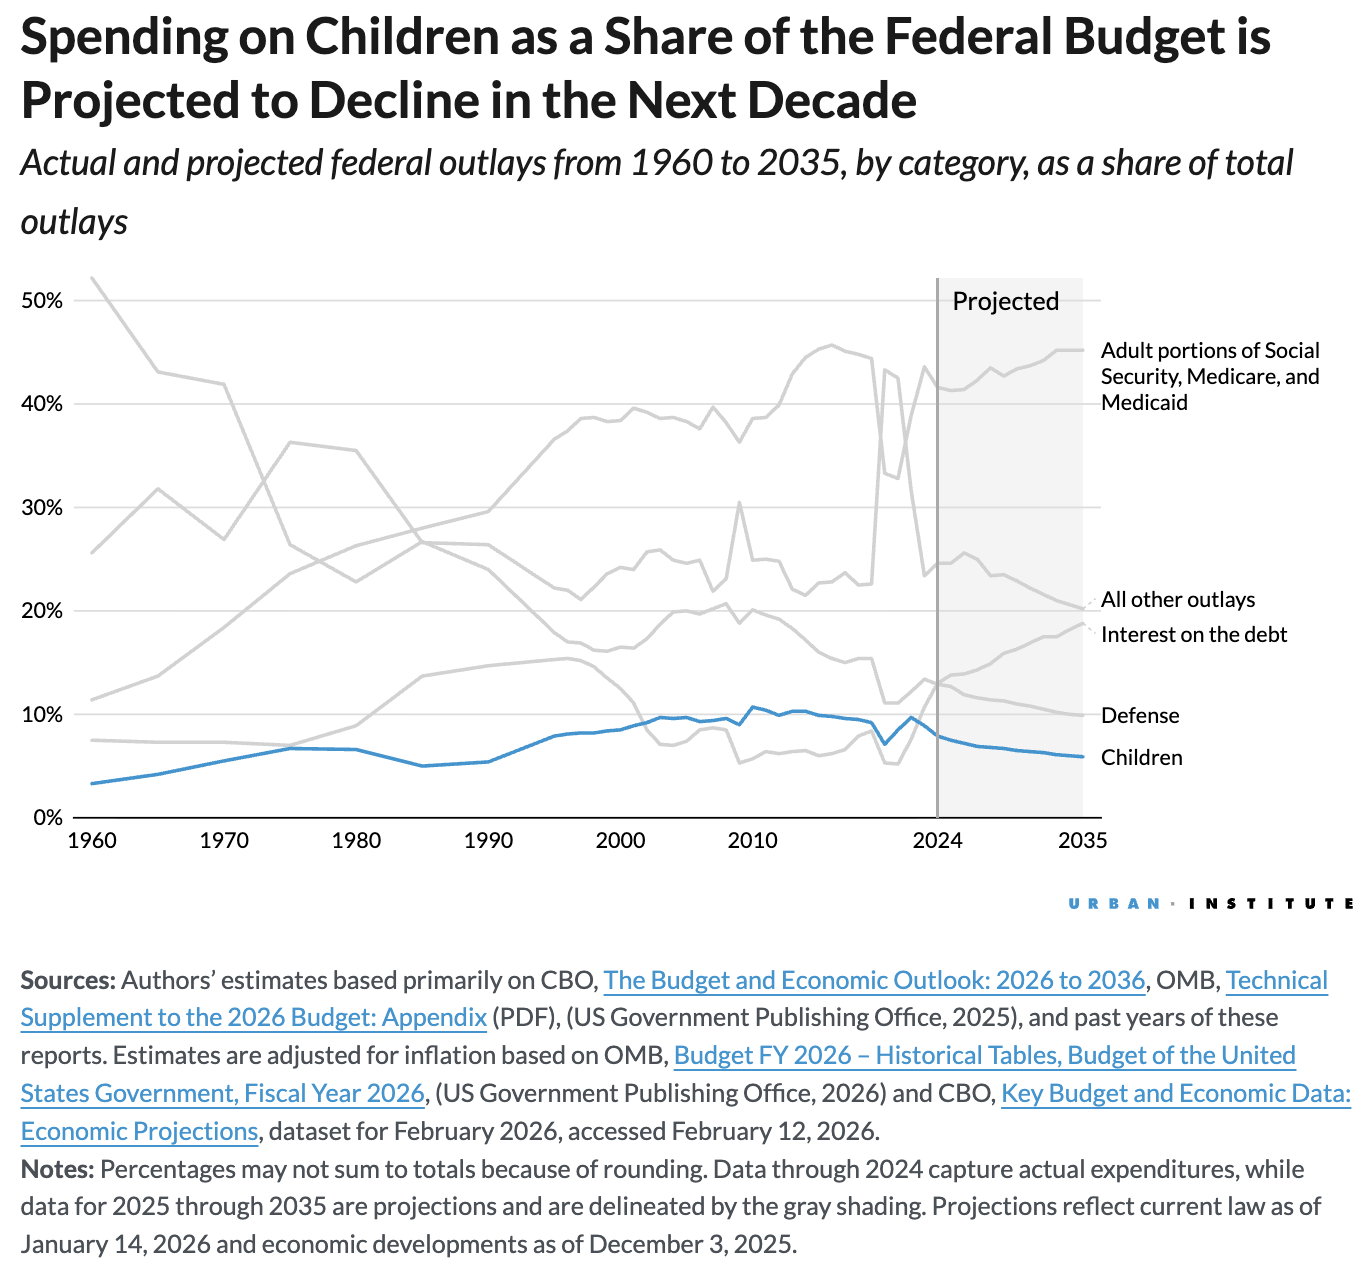
- In 2024, 8 percent of all federal spending was on children, totaling $533 billion. This spending is projected to decline to 6 percent by 2035.
- The federal government spent about $8,570 per child in 2024, primarily through tax provisions and health programs.
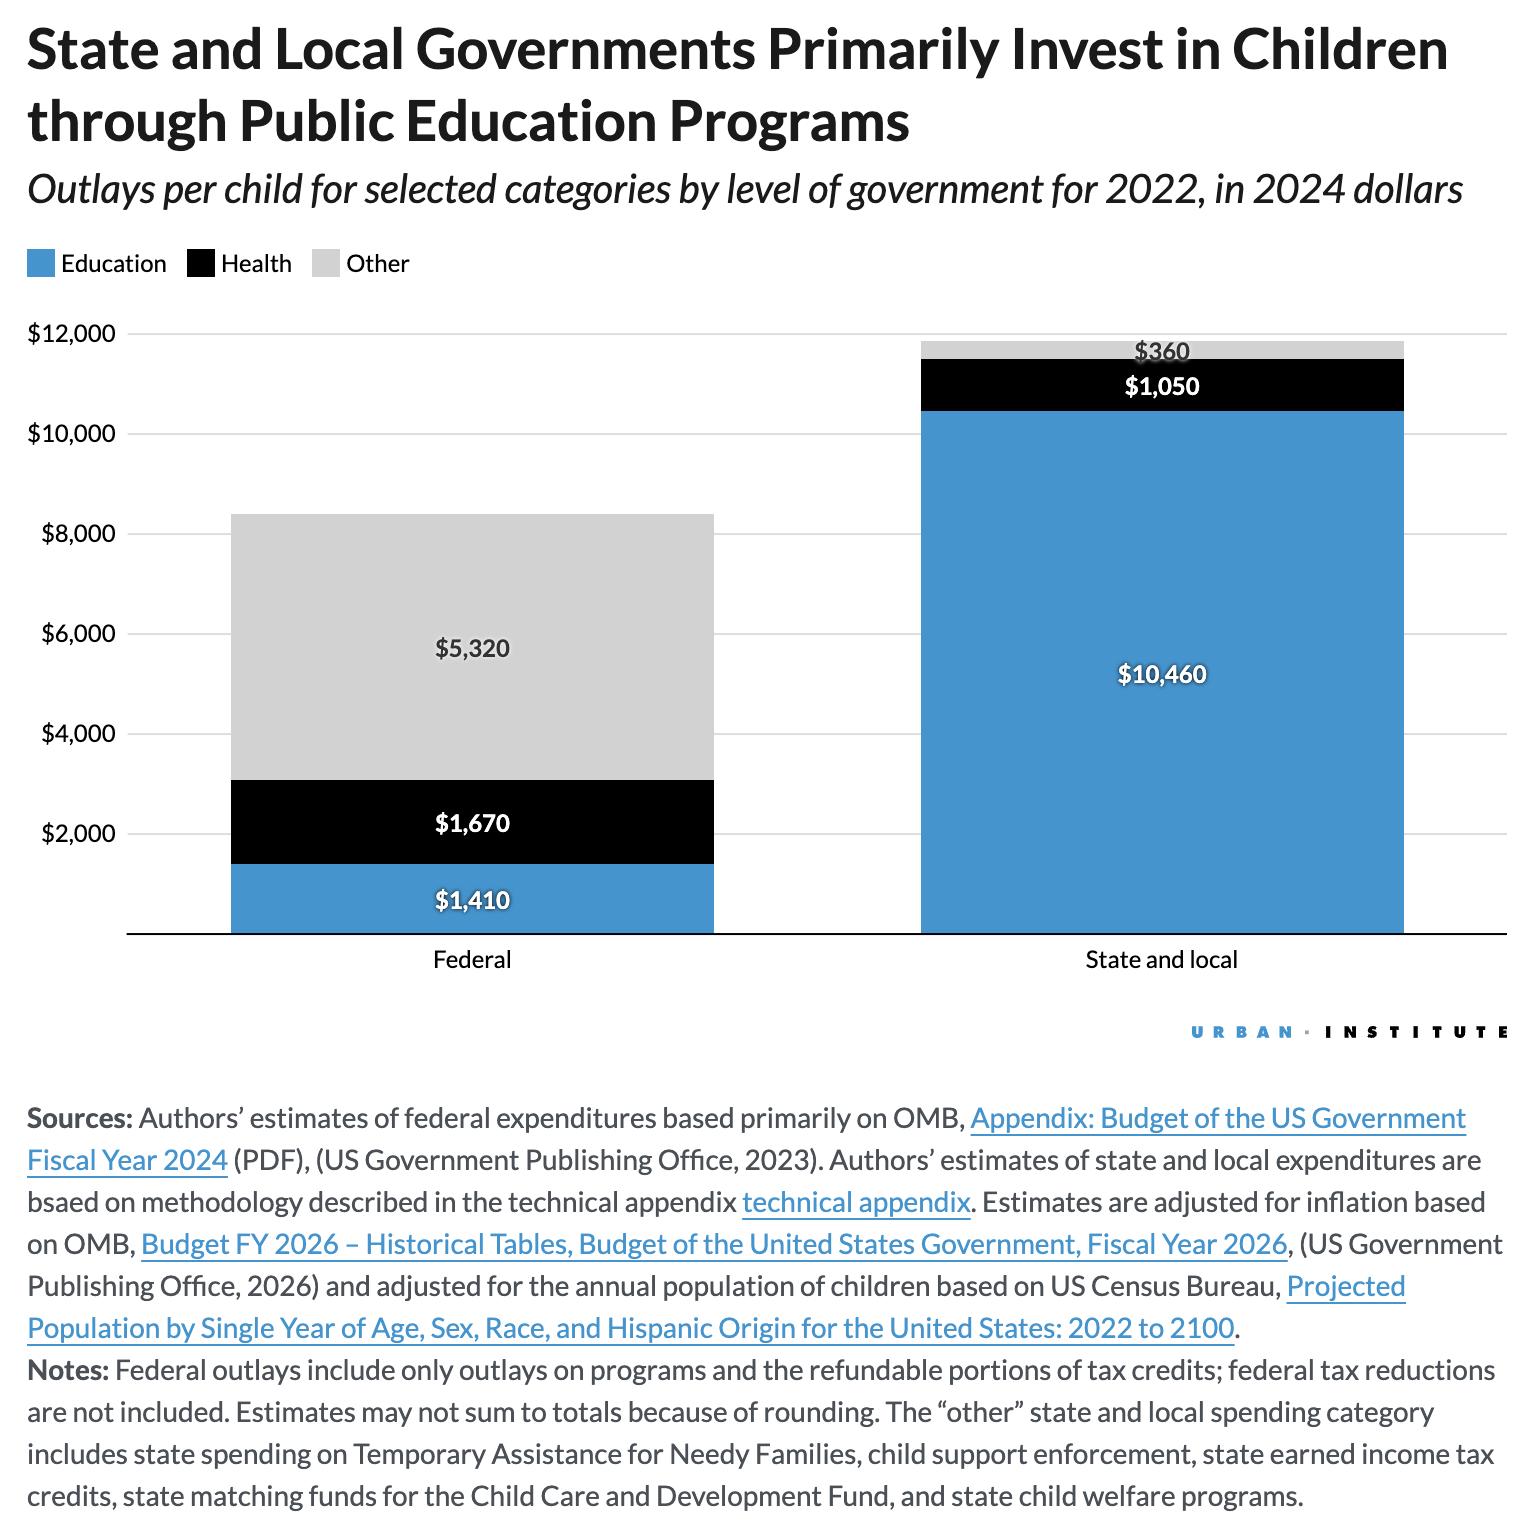
- Federal investments make up only about two-fifths of spending on children. Most spending on children comes from state and local governments, which primarily invest in children through public education programs.
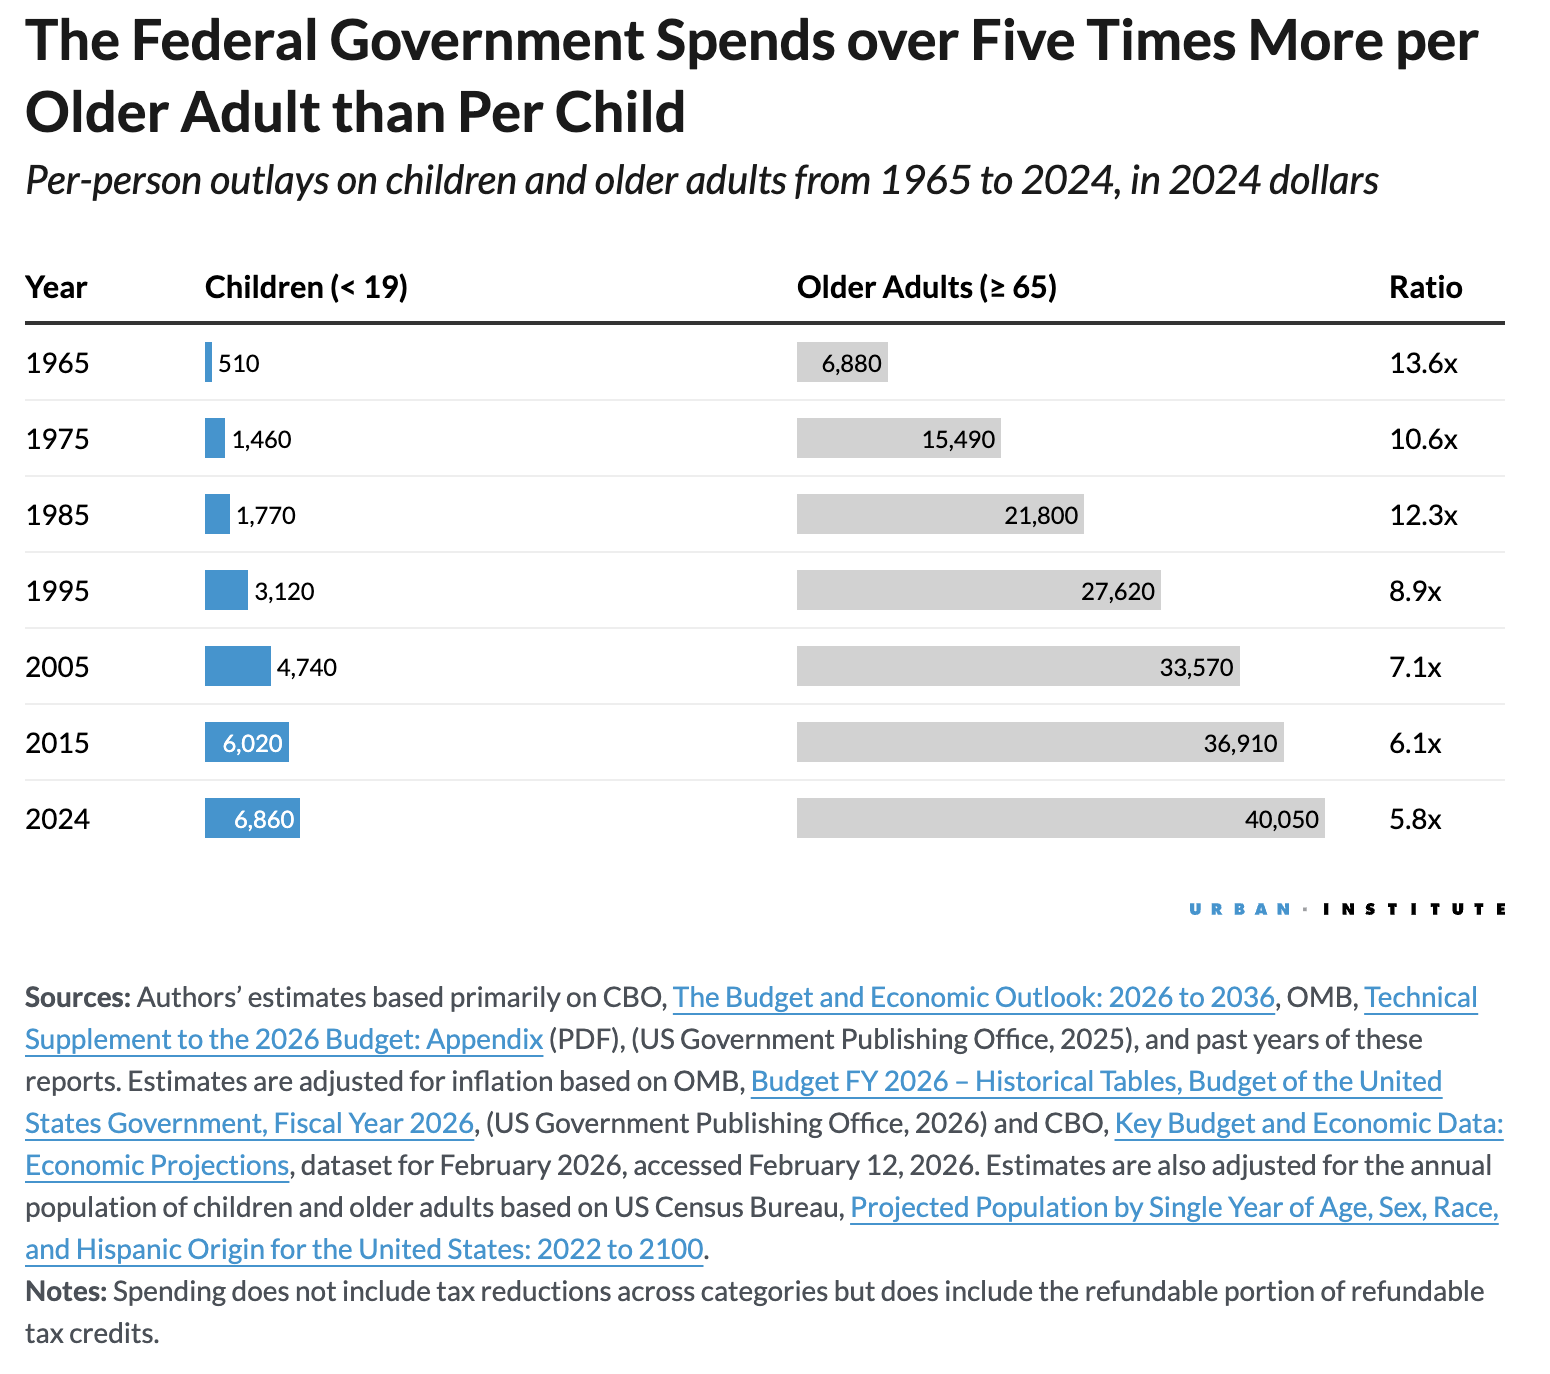
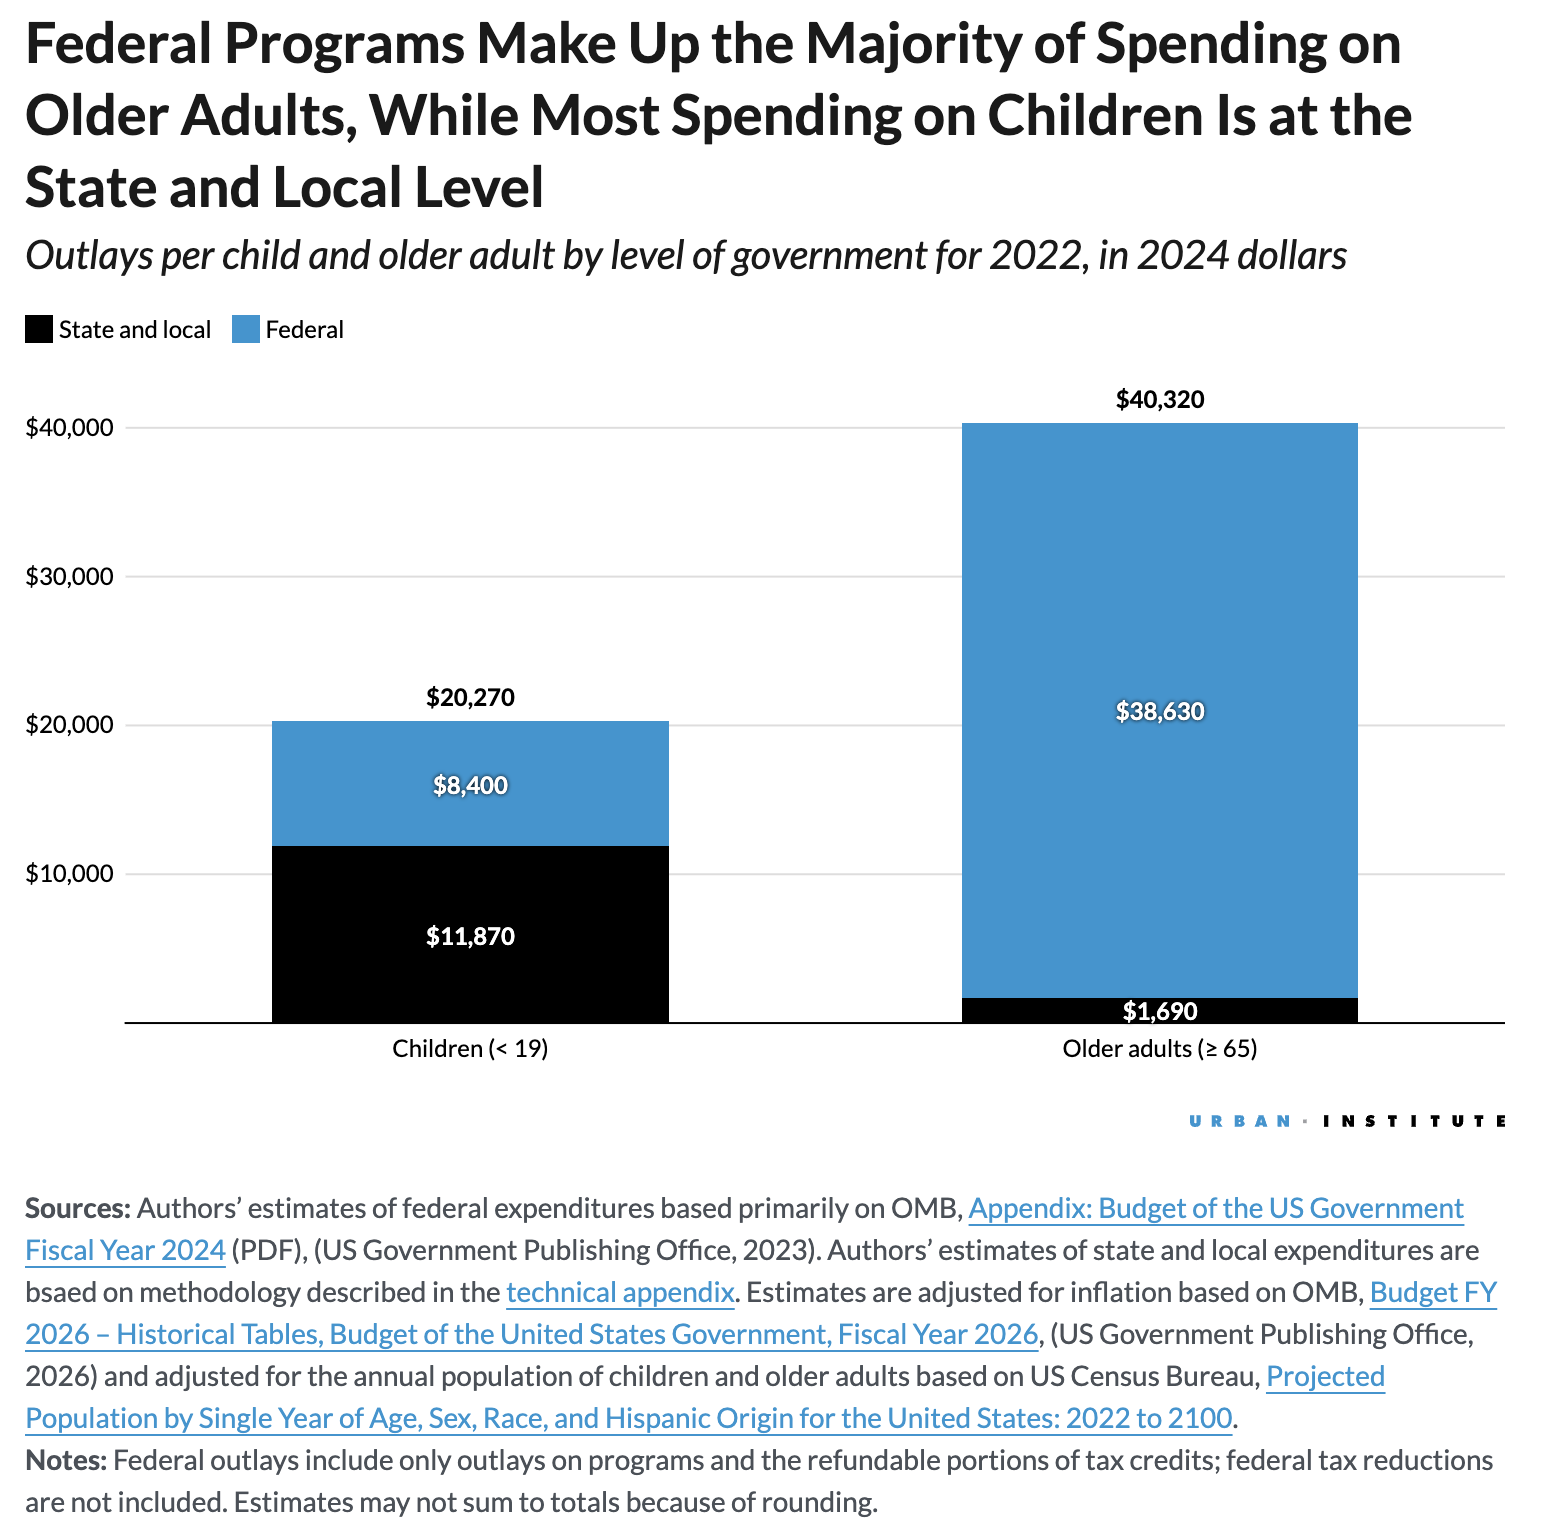
- The federal government spends five times more per older adult (ages 65 and older) than per child (ages 18 and under).
- Spending on children relative to the economy is projected to fall from 1.8 percent of GDP in 2024 to 1.4 percent of GDP by 2035.
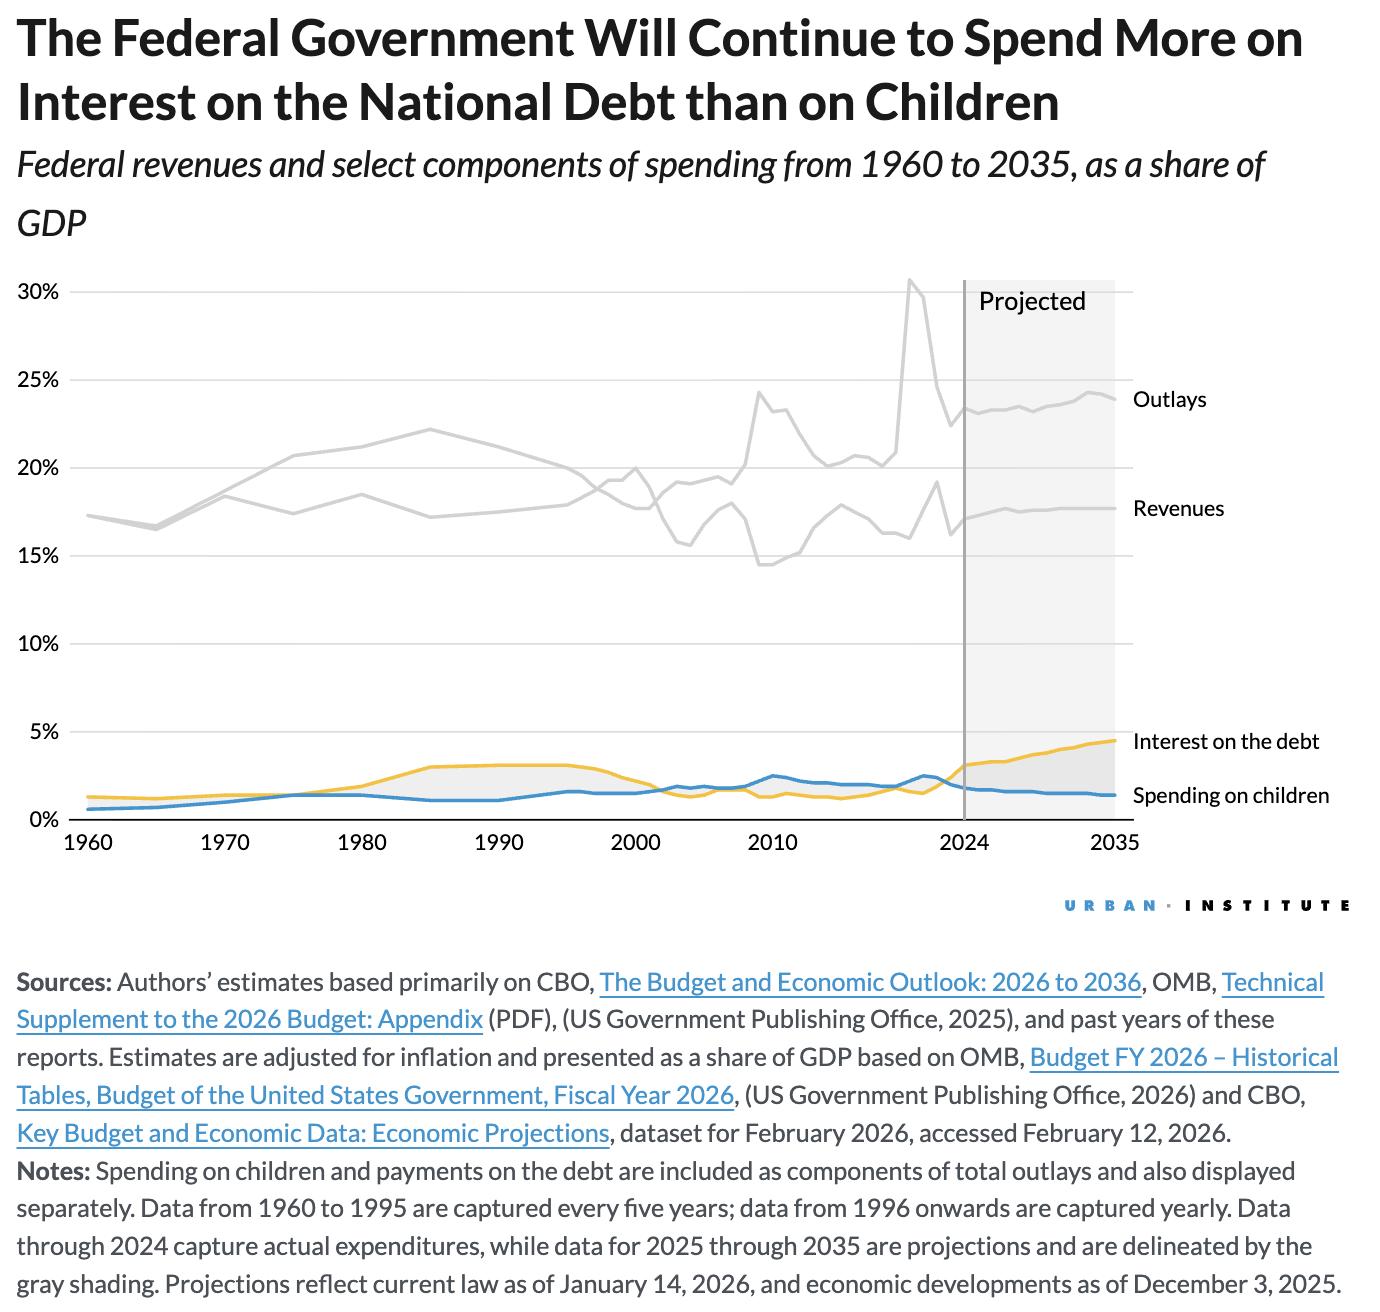
- By 2035, the federal government is projected to spend three times more on interest on the national debt than on children.
Data on Spending on Kids
Federal Spending on Kids versus Other Types of Spending
FIGURE 1
Spending on Children Was the Smallest Share of the Federal Budget in 2024
Sources: Authors’ estimates based primarily on OMB, Technical Supplement to the 2026 Budget: Appendix (PDF), (US Government Publishing Office, 2025) and past years of this report.
Notes: Percentages may not sum to totals because of rounding. Spending does not include tax reductions across categories but does include the refundable portion of refundable tax credits.
FIGURE 2
Spending on Children as a Share of the Federal Budget is Projected to Decline in the Next Decade
Sources: Authors’ estimates based primarily on CBO, The Budget and Economic Outlook: 2026 to 2036, OMB, Technical Supplement to the 2026 Budget: Appendix (PDF), (US Government Publishing Office, 2025), and past years of these reports. Estimates are adjusted for inflation based on OMB, Budget FY 2026 – Historical Tables, Budget of the United States Government, Fiscal Year 2026, (US Government Publishing Office, 2026) and CBO, Key Budget and Economic Data: Economic Projections, dataset for February 2026, accessed February 12, 2026.
Notes: Percentages may not sum to totals because of rounding. Data through 2024 capture actual expenditures, while data for 2025 through 2035 are projections and are delineated by the gray shading. Projections reflect current law as of January 14, 2026 and economic developments as of December 3, 2025.
FIGURE 3
Spending on Children Will Decrease, Even As Federal Spending Relative to the Economy Will Increase
Sources: Authors’ estimates based primarily on CBO, The Budget and Economic Outlook: 2026 to 2036, OMB, Technical Supplement to the 2026 Budget: Appendix (PDF), (US Government Publishing Office, 2025), and past years of these reports. Estimates are adjusted for inflation and presented as a share of GDP based on OMB, Budget FY 2026 – Historical Tables, Budget of the United States Government, Fiscal Year 2026, (US Government Publishing Office, 2026) and CBO, Key Budget and Economic Data: Economic Projections, dataset for February 2026, accessed February 12, 2026.
Notes: Data from 1960 to 1995 are captured every five years; data from 1996 onwards are captured yearly. Data through 2024 capture actual expenditures, while data for 2025 through 2035 are projections and are delineated by the gray shading. Projections reflect current law as of January 14, 2026, and economic developments as of December 3, 2025.
FIGURE 4
The Federal Government Will Continue to Spend More on Interest on the National Debt than on Children
Sources: Authors’ estimates based primarily on CBO, The Budget and Economic Outlook: 2026 to 2036, OMB, Technical Supplement to the 2026 Budget: Appendix (PDF), (US Government Publishing Office, 2025), and past years of these reports. Estimates are adjusted for inflation and presented as a share of GDP based on OMB, Budget FY 2026 – Historical Tables, Budget of the United States Government, Fiscal Year 2026, (US Government Publishing Office, 2026) and CBO, Key Budget and Economic Data: Economic Projections, dataset for February 2026, accessed February 12, 2026.
Notes: Spending on children and payments on the debt are included as components of total outlays and also displayed separately. Data from 1960 to 1995 are captured every five years; data from 1996 onwards are captured yearly. Data through 2024 capture actual expenditures, while data for 2025 through 2035 are projections and are delineated by the gray shading. Projections reflect current law as of January 14, 2026, and economic developments as of December 3, 2025.
FIGURE 5
The Federal Government Spends over Five Times More per Older Adult than Per Child
Per-person outlays on children and older adults from 1965 to 2024, in 2024 dollars
Sources: Authors’ estimates based primarily on CBO, The Budget and Economic Outlook: 2026 to 2036, OMB, Technical Supplement to the 2026 Budget: Appendix (PDF), (US Government Publishing Office, 2025), and past years of these reports. Estimates are adjusted for inflation based on OMB, Budget FY 2026 – Historical Tables, Budget of the United States Government, Fiscal Year 2026, (US Government Publishing Office, 2026) and CBO, Key Budget and Economic Data: Economic Projections, dataset for February 2026, accessed February 12, 2026. Estimates are also adjusted for the annual population of children and older adults based on US Census Bureau, Projected Population by Single Year of Age, Sex, Race, and Hispanic Origin for the United States: 2022 to 2100.
Notes: Spending does not include tax reductions across categories but does include the refundable portion of refundable tax credits.
Federal Spending on Kids by Category and Program
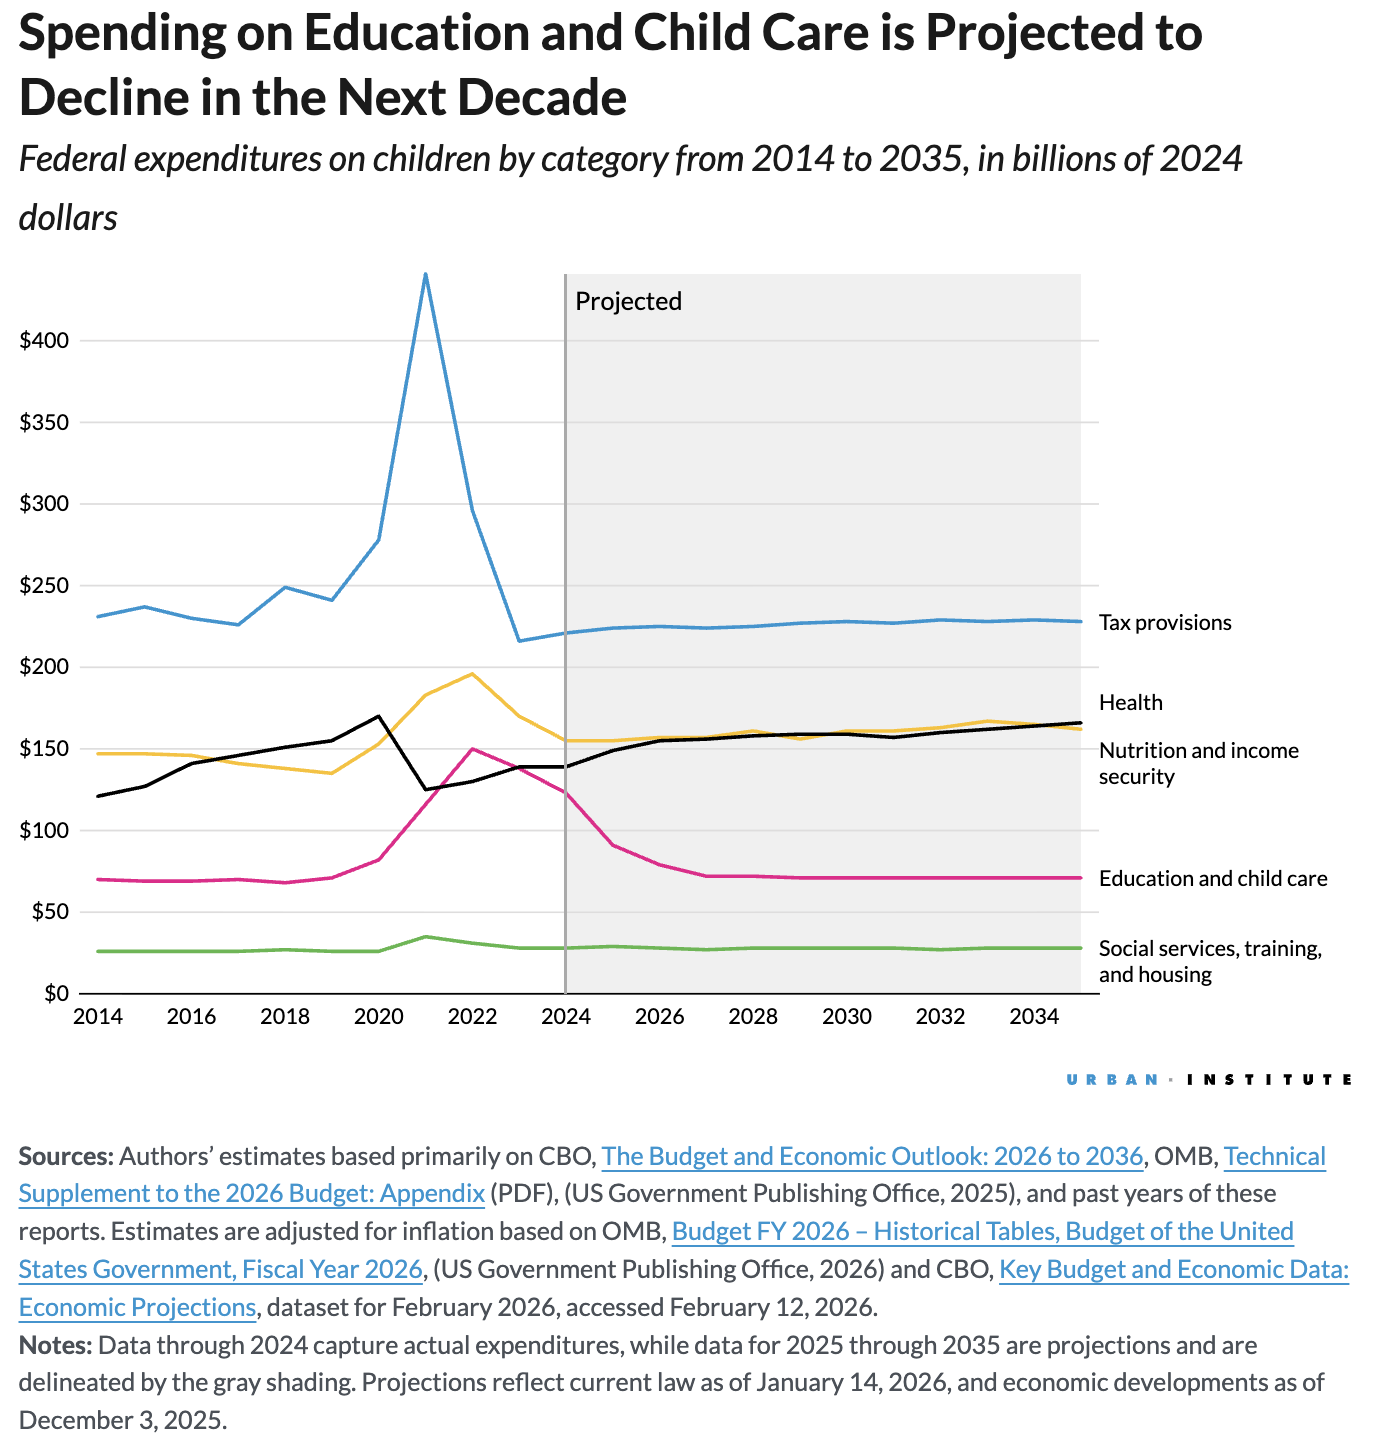
FIGURE 6
Spending on Education and Child Care is Projected to Decline in the Next Decade
Federal expenditures on children by category from 2014 to 2035, in billions of 2024 dollars
Sources: Authors’ estimates based primarily on CBO, The Budget and Economic Outlook: 2026 to 2036, OMB, Technical Supplement to the 2026 Budget: Appendix (PDF), (US Government Publishing Office, 2025), and past years of these reports. Estimates are adjusted for inflation based on OMB, Budget FY 2026 – Historical Tables, Budget of the United States Government, Fiscal Year 2026, (US Government Publishing Office, 2026) and CBO, Key Budget and Economic Data: Economic Projections, dataset for February 2026, accessed February 12, 2026.
Notes: Data through 2024 capture actual expenditures, while data for 2025 through 2035 are projections and are delineated by the gray shading. Projections reflect current law as of January 14, 2026, and economic developments as of December 3, 2025.
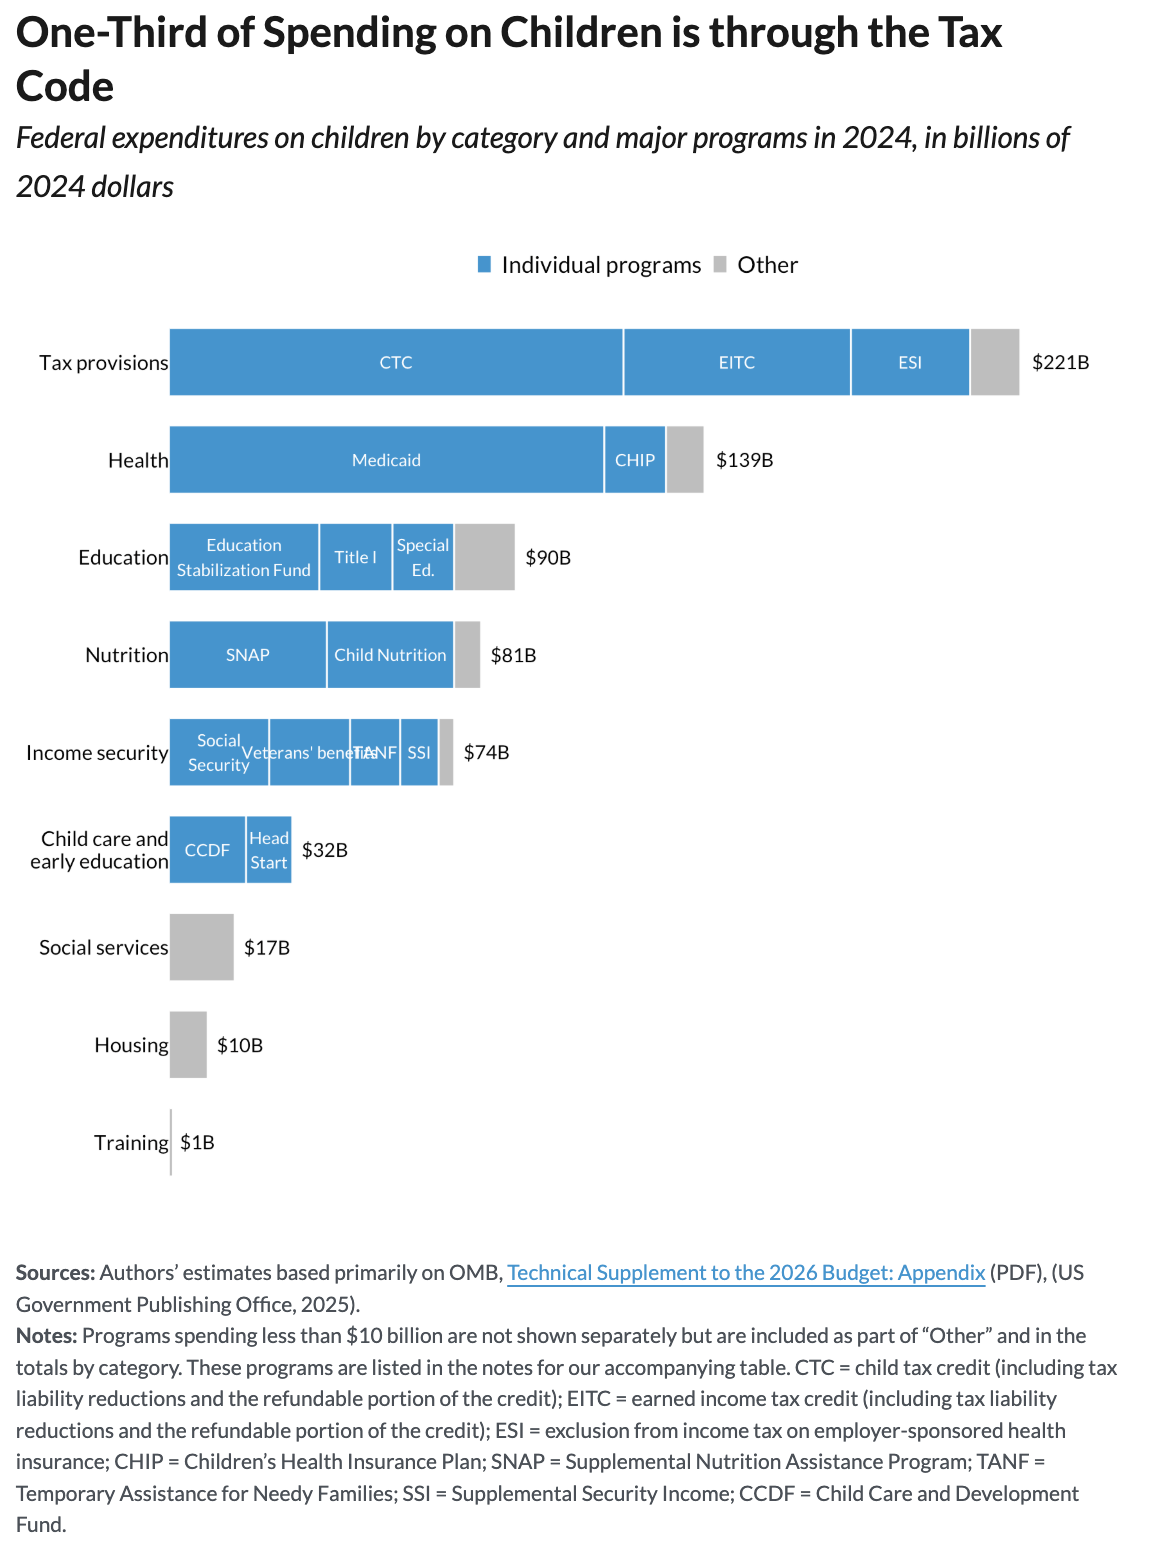
FIGURE 7
One-Third of Spending on Children is through the Tax Code
Federal expenditures on children by category and major programs in 2024, in billions of 2024 dollars
Sources: Authors’ estimates based primarily on OMB, Technical Supplement to the 2026 Budget: Appendix (PDF), (US Government Publishing Office, 2025).
Notes: Programs spending less than $10 billion are not shown separately but are included as part of “Other” and in the totals by category. These programs are listed in the notes for our accompanying table. CTC = child tax credit (including tax liability reductions and the refundable portion of the credit); EITC = earned income tax credit (including tax liability reductions and the refundable portion of the credit); ESI = exclusion from income tax on employer-sponsored health insurance; CHIP = Children’s Health Insurance Plan; SNAP = Supplemental Nutrition Assistance Program; TANF = Temporary Assistance for Needy Families; SSI = Supplemental Security Income; CCDF = Child Care and Development Fund.
TABLE 1
Spending on Children Has Increased over Time
Federal expenditures on children by category and major programs for select years from 1965 to 2024, in billions of 2024 dollars
| 1965 | 1985 | 2005 | 2015 | 2023 | 2024 | |
|---|---|---|---|---|---|---|
| 1. Health | 0.7 | 10.5 | 72.9 | 126.8 | 138.9 | 138.8 |
| Medicaid | – | 9.7 | 61.1 | 108.1 | 115.8 | 112.7 |
| CHIP | – | – | 6.9 | 11.2 | 14.9 | 15.9 |
| Vaccines for Children | – | – | 2.2 | 4.9 | 5.3 | 7.2 |
| Other health | 0.7 | 0.9 | 2.8 | 2.7 | 2.9 | 2.9 |
| 2. Nutrition | 2.1 | 26.6 | 50.2 | 76.0 | 97.2 | 80.2 |
| SNAP (formerly Food Stamps) | 0.1 | 14.3 | 25.3 | 42.0 | 61.0 | 41.0 |
| Child nutrition | 2.0 | 9.0 | 18.2 | 26.8 | 29.8 | 32.5 |
| Special Supplemental Food (WIC) | – | 3.2 | 6.7 | 7.2 | 6.4 | 6.7 |
| Other nutrition | – | 0.1 | – | – | – | – |
| 3. Education | 5.3 | 19.9 | 60.7 | 51.7 | 98.0 | 90.5 |
| Education for the Disadvantaged (Title I, Part A) | – | 10.4 | 22.5 | 19.5 | 18.4 | 18.9 |
| Special education/IDEA | 0.1 | 2.5 | 16.8 | 15.7 | 15.7 | 16.3 |
| School Improvement | 0.5 | 1.3 | 10.7 | 5.5 | 5.8 | 6.0 |
| Other education | 0.6 | 1.9 | 4.8 | 5.1 | 3.8 | 4.1 |
| Impact Aid | 2.7 | 1.6 | 1.9 | 1.8 | 1.8 | 1.9 |
| Innovation & Improvement | – | – | 0.8 | 1.5 | 1.0 | 1.1 |
| Dependents' schools abroad | 0.6 | 1.5 | 1.6 | 1.4 | 1.2 | 1.2 |
| Indian Education | 0.8 | 0.7 | 1.4 | 1.1 | 1.7 | 1.6 |
| Emergency Connectivity Fund | – | – | – | – | 1.8 | – |
| Education Stabilization Fund | – | – | – | – | 46.9 | 39.3 |
| 4. Income Security | 26.9 | 38.6 | 65.7 | 70.8 | 72.5 | 74.5 |
| Social Security | 11.9 | 20.4 | 26.1 | 27.6 | 25.8 | 26.1 |
| Temporary Assistance for Needy Families | 9.0 | 12.9 | 20.4 | 16.3 | 13.0 | 13.3 |
| Supplemental Security Income | – | 2.0 | 11.6 | 14.4 | 11.2 | 10.1 |
| Veterans Benefits | 5.7 | – | 3.3 | 8.3 | 18.3 | 20.6 |
| Child support enforcement | – | 0.5 | 4.3 | 4.3 | 4.1 | 4.4 |
| Other income security | 0.3 | 0.2 | – | – | – | – |
| Veterans' benefits | – | 2.6 | – | – | – | – |
| 5. Child Care and Early Education | 0.7 | 2.5 | 17.9 | 17.6 | 40.0 | 32.4 |
| Head Start (including Early Head Start) | 0.7 | 2.5 | 10.3 | 10.7 | 12.5 | 12.3 |
| CCDF | – | – | 7.5 | 6.6 | 27.2 | 19.9 |
| Other child care and early education | – | – | – | 0.3 | 0.4 | 0.3 |
| 6. Social Services | 0.1 | 5.8 | 14.6 | 13.4 | 17.4 | 17.1 |
| Foster care | – | 1.2 | 6.9 | 5.9 | 5.2 | 5.3 |
| Adoption Assistance | – | 0.1 | 2.7 | 3.1 | 4.1 | 4.1 |
| Other social services | 0.1 | 1.0 | 3.2 | 2.3 | 2.8 | 2.5 |
| Social Services Block Grant | – | 3.5 | 1.6 | 1.3 | 1.0 | 1.0 |
| Unaccompanied alien children | – | – | 0.1 | 0.8 | 4.3 | 4.2 |
| 7. Housing | 0.3 | 7.2 | 12.3 | 10.8 | 10.1 | 10.2 |
| Section 8 low-income housing assistance | – | 4.4 | 9.9 | 8.5 | 7.7 | 8.5 |
| Other housing | 0.3 | 1.3 | 1.7 | 1.4 | 1.3 | 0.8 |
| Low Income Home Energy Assistance | – | 1.5 | 0.7 | 0.9 | 1.1 | 0.9 |
| 8. Training | 1.1 | 3.6 | 2.4 | 1.6 | 0.5 | 0.7 |
| Other training | 1.1 | 3.6 | 2.4 | 1.6 | 0.5 | 0.7 |
| 9. Refundable Portions of Tax Credits | – | 2.6 | 71.0 | 100.2 | 83.9 | 88.0 |
| Earned income tax credit | – | 2.6 | 48.5 | 63.8 | 47.4 | 50.9 |
| Child tax credit | – | – | 22.5 | 34.8 | 34.4 | 34.6 |
| Other refundable tax credits | – | – | – | 1.1 | 0.6 | 0.5 |
| Premium tax credit | – | – | – | 0.6 | 1.5 | 2.0 |
| 10. Tax Reductions | 47.3 | 50.3 | 129.0 | 136.5 | 132.2 | 133.3 |
| Dependent exemption | 46.3 | 31.2 | 40.5 | 47.1 | – | – |
| Child tax credit (nonrefundable portion) | – | – | 49.4 | 38.1 | 84.5 | 83.9 |
| Exclusion for employer-sponsored health insurance | – | 6.7 | 22.9 | 31.5 | 29.7 | 31.4 |
| Earned income tax credit (nonrefundable portion) | – | 0.8 | 6.9 | 9.1 | 7.6 | 7.9 |
| Other tax reductions | 0.8 | 2.4 | 4.4 | 5.5 | 4.9 | 4.4 |
| Dependent care credit (nonrefundable portion) | – | 8.9 | 4.6 | 4.5 | 4.0 | 4.1 |
| Exclusion for Veterans Death and Disability Compensation | 0.2 | 0.3 | 0.3 | 0.7 | 1.5 | 1.6 |
| TOTAL EXPENDITURES ON CHILDREN | 84.5 | 167.6 | 496.6 | 605.3 | 690.8 | 665.6 |
| SUBTOTAL, OUTLAYS WITHOUT TAX REDUCTIONS (1-9) | 37.2 | 117.2 | 367.6 | 468.8 | 558.5 | 532.4 |
Sources: Authors’ estimates based primarily on OMB, Technical Supplement to the 2026 Budget: Appendix (PDF), (US Government Publishing Office, 2025) and past years of this report. Estimates are adjusted for inflation based on OMB, Budget FY 2026 – Historical Tables, Budget of the United States Government, Fiscal Year 2026, (US Government Publishing Office, 2026) and CBO, Key Budget and Economic Data: Economic Projections, dataset for February 2026, accessed February 12, 2026.
Notes: Because this analysis shows outlays rather than appropriated or authorized levels, and because the dollars are adjusted for inflation, these estimates may differ from other published estimates. Individual programs are shown only when expenditures on children are $1 billion or greater in 2024. Numbers may not sum to totals because of rounding.
Other health covers immunizations, the Maternal and Child Health block grant, children’s hospitals graduate medical education, lead hazard reduction, children’s mental health services, birth defects/developmental disabilities, Healthy Start, home visiting, and school-based health care.
Child nutrition includes the National School Lunch Program, the School Breakfast Program, the Child and Adult Care Food Program, the Summer Food Service Program, and the Special Milk Program.
Other education includes English language acquisition; Department of Defense domestic schools; the Institute of Education Sciences; safe schools and citizenship education; Junior ROTC; and career, technical, and adult education (formerly vocational and adult education); and STOP school violence.
Other income security includes Railroad Retirement. Other early education and care includes Preschool Development Grants.
Other social services include the Community Services Block Grant, child welfare services and training, Safe and Stable Families, juvenile justice, guardianship, independent living, missing children, children’s research and technical assistance, the Personal Responsibility Education Program and abstinence education, the Unaccompanied Refugee Minors program, and certain child and family services programs.
Other housing includes public housing, emergency rental assistance, and rental housing assistance.
Training includes Workplace Innovation and Opportunity Act Youth Formula grants, Job Corps, youth offender grants, and YouthBuild grants.
Other refundable tax credits include outlays from economic impact payments, Qualified Zone Academy Bonds and Qualified School Construction Bonds.
Other tax reductions include economic impact payments; the employer-provided child care credit; the adoption credit; assistance for adopted foster children; the nonrefundable portions of Qualified Zone Academy Bonds, Qualified School Construction Bonds, and the premium tax credit; and tax exclusions for employer-provided child care, certain foster care payments, adoption expenses, Social Security retirement and dependents’ and survivors benefits, and public assistance benefits.
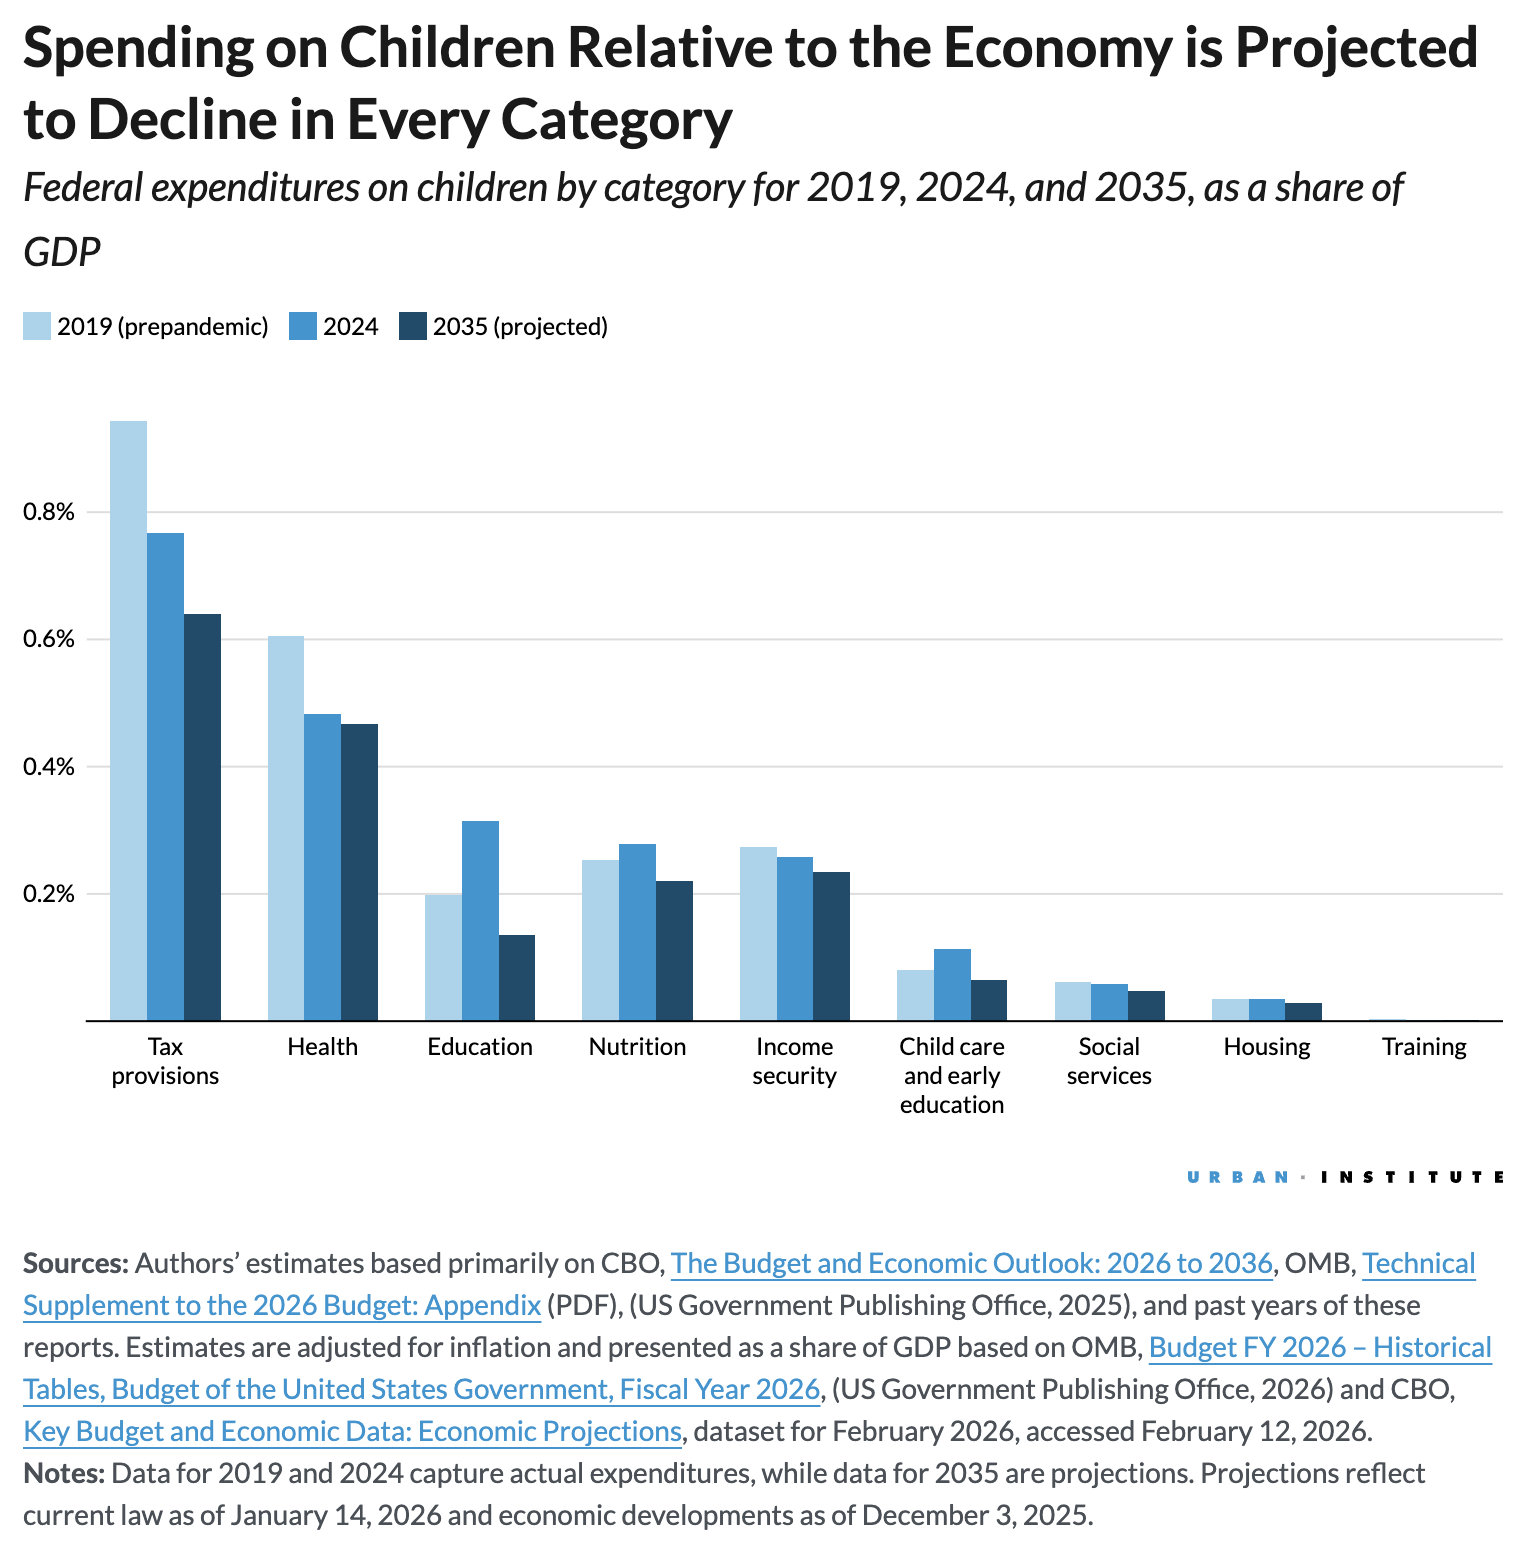
FIGURE 8
Spending on Children Relative to the Economy is Projected to Decline in Every Category
Sources: Authors’ estimates based primarily on CBO, The Budget and Economic Outlook: 2026 to 2036, OMB, Technical Supplement to the 2026 Budget: Appendix (PDF), (US Government Publishing Office, 2025), and past years of these reports. Estimates are adjusted for inflation and presented as a share of GDP based on OMB, Budget FY 2026 – Historical Tables, Budget of the United States Government, Fiscal Year 2026, (US Government Publishing Office, 2026) and CBO, Key Budget and Economic Data: Economic Projections, dataset for February 2026, accessed February 12, 2026.
Notes: Data for 2019 and 2024 capture actual expenditures, while data for 2035 are projections. Projections reflect current law as of January 14, 2026 and economic developments as of December 3, 2025.
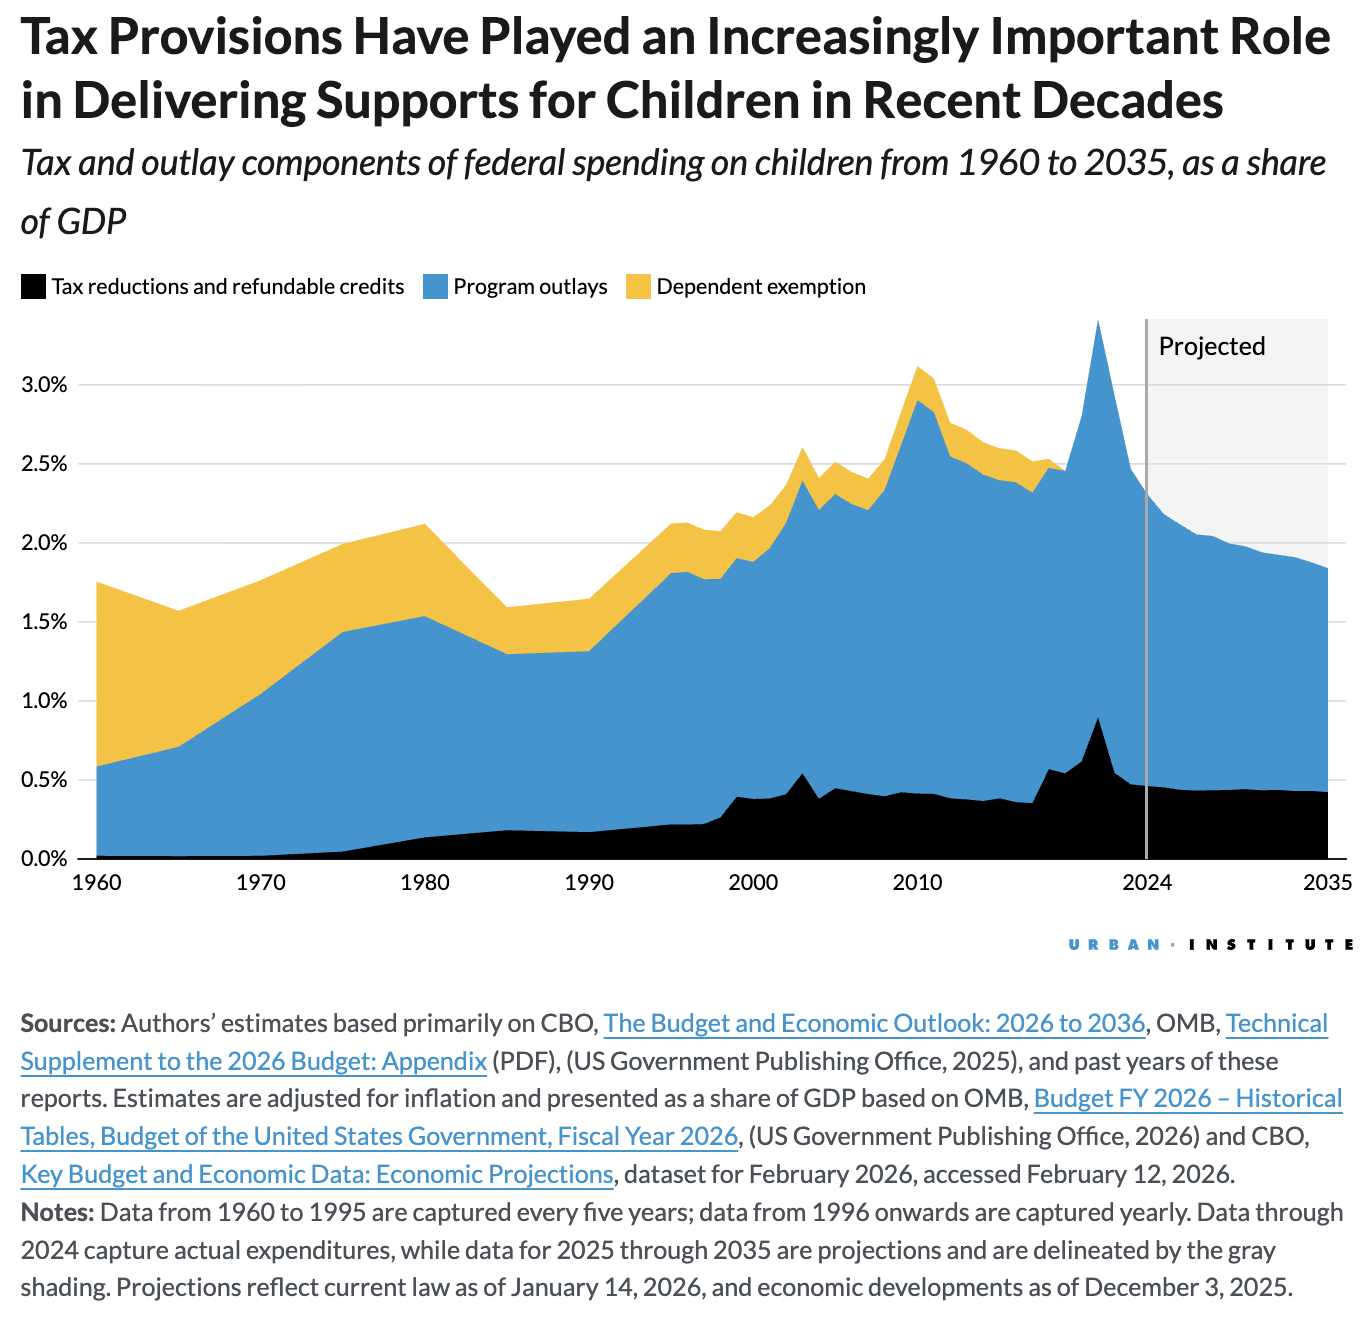
FIGURE 9
Tax Provisions Have Played an Increasingly Important Role in Delivering Supports for Children in Recent Decades
Sources: Authors’ estimates based primarily on CBO, The Budget and Economic Outlook: 2026 to 2036, OMB, Technical Supplement to the 2026 Budget: Appendix (PDF), (US Government Publishing Office, 2025), and past years of these reports. Estimates are adjusted for inflation and presented as a share of GDP based on OMB, Budget FY 2026 – Historical Tables, Budget of the United States Government, Fiscal Year 2026, (US Government Publishing Office, 2026) and CBO, Key Budget and Economic Data: Economic Projections, dataset for February 2026, accessed February 12, 2026.
Notes: Data from 1960 to 1995 are captured every five years; data from 1996 onwards are captured yearly. Data through 2024 capture actual expenditures, while data for 2025 through 2035 are projections and are delineated by the gray shading. Projections reflect current law as of January 14, 2026, and economic developments as of December 3, 2025.
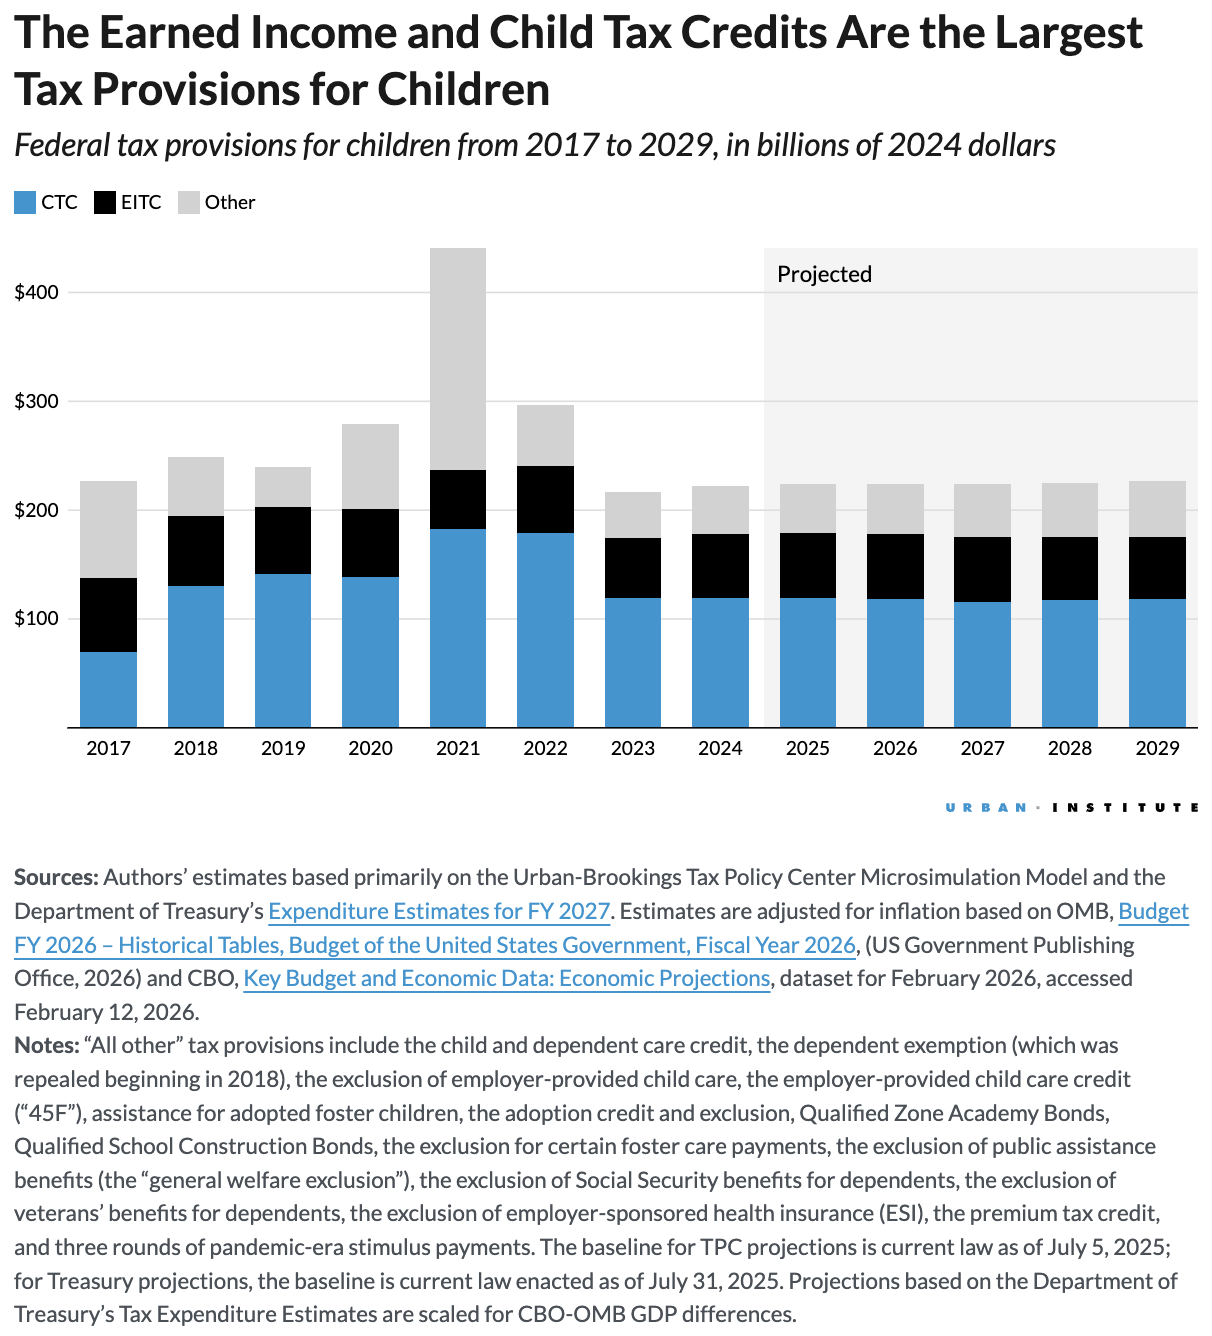
FIGURE 10
The Earned Income and Child Tax Credits Are the Largest Tax Provisions for Children
Federal tax provisions for children from 2017 to 2029, in billions of 2024 dollars
Sources: Authors’ estimates based primarily on the Urban-Brookings Tax Policy Center Microsimulation Model and the Department of Treasury’s Expenditure Estimates for FY 2027. Estimates are adjusted for inflation based on OMB, Budget FY 2026 – Historical Tables, Budget of the United States Government, Fiscal Year 2026, (US Government Publishing Office, 2026) and CBO, Key Budget and Economic Data: Economic Projections, dataset for February 2026, accessed February 12, 2026.
Notes: “All other” tax provisions include the child and dependent care credit, the dependent exemption (which was repealed beginning in 2018), the exclusion of employer-provided child care, the employer-provided child care credit (“45F”), assistance for adopted foster children, the adoption credit and exclusion, Qualified Zone Academy Bonds, Qualified School Construction Bonds, the exclusion for certain foster care payments, the exclusion of public assistance benefits (the “general welfare exclusion”), the exclusion of Social Security benefits for dependents, the exclusion of veterans’ benefits for dependents, the exclusion of employer-sponsored health insurance (ESI), the premium tax credit, and three rounds of pandemic-era stimulus payments. The baseline for TPC projections is current law as of July 5, 2025; for Treasury projections, the baseline is current law enacted as of July 31, 2025. Projections based on the Department of Treasury’s Tax Expenditure Estimates are scaled for CBO-OMB GDP differences.
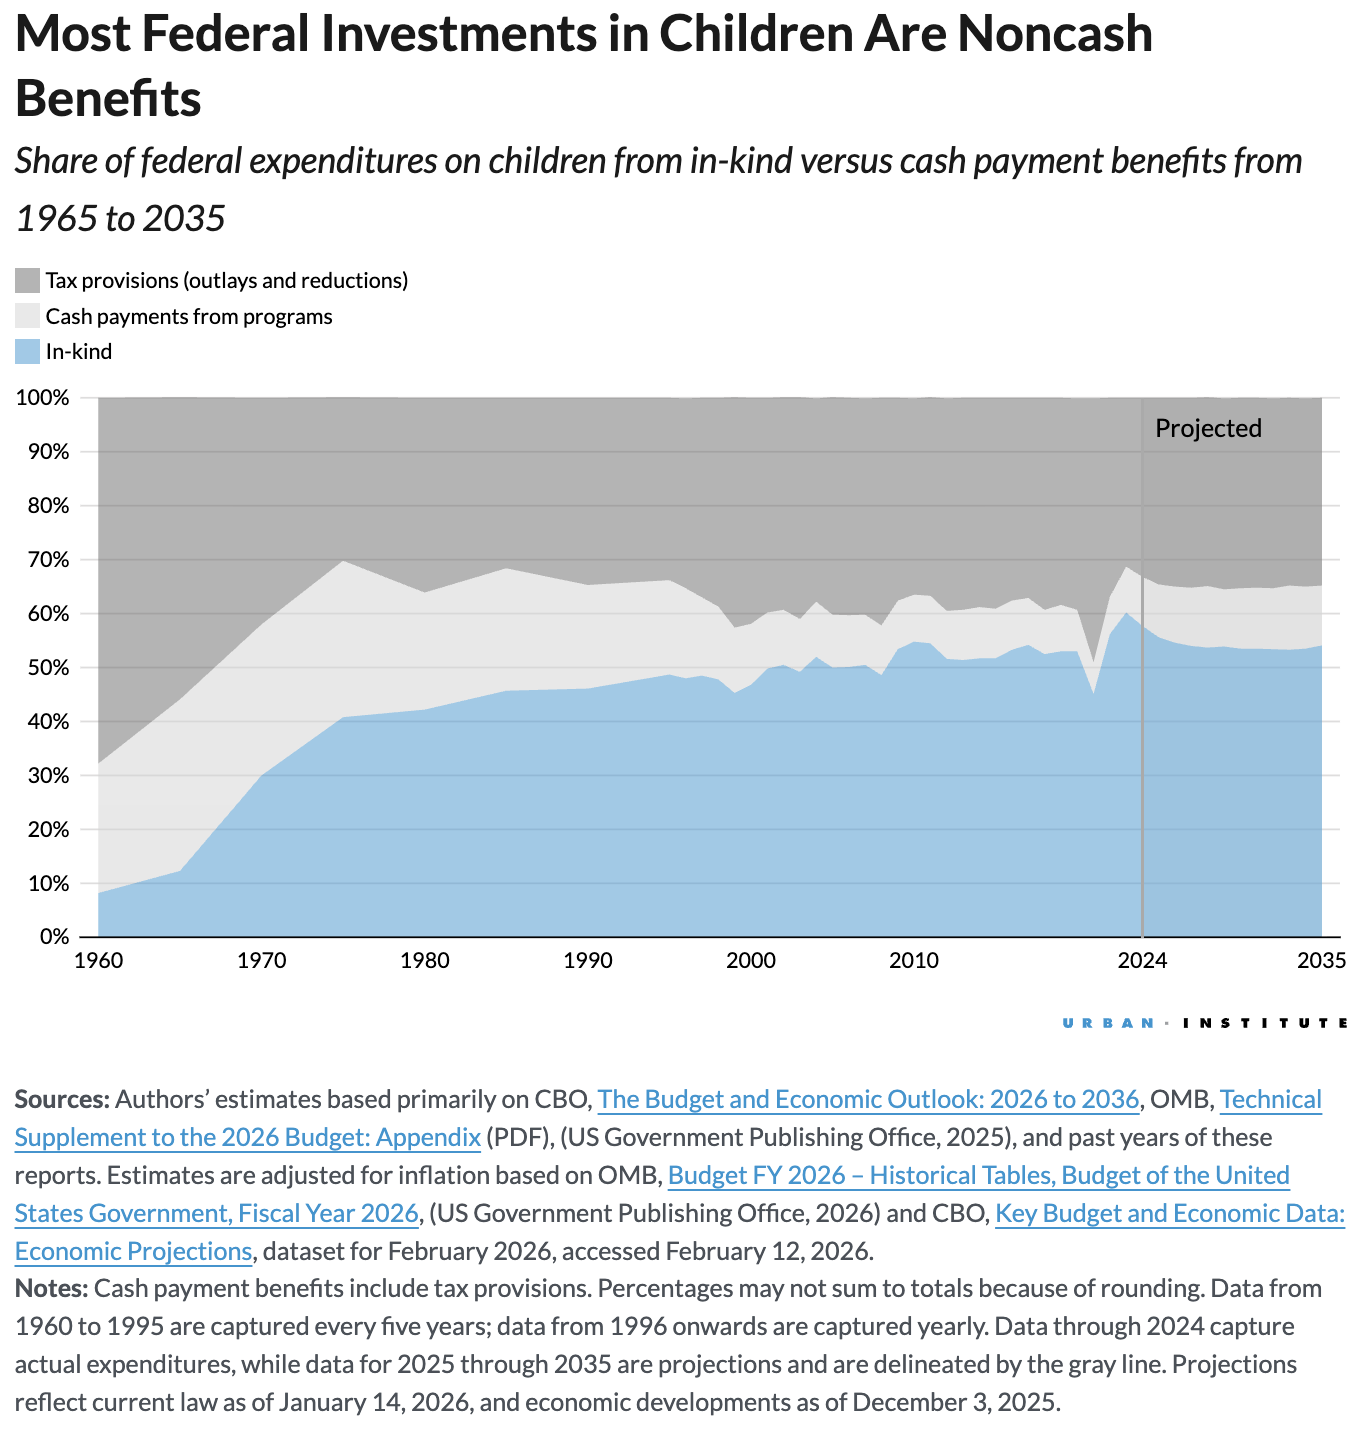
FIGURE 11
Most Federal Investments in Children Are Noncash Benefits
Sources: Authors’ estimates based primarily on CBO, The Budget and Economic Outlook: 2026 to 2036, OMB, Technical Supplement to the 2026 Budget: Appendix (PDF), (US Government Publishing Office, 2025), and past years of these reports. Estimates are adjusted for inflation based on OMB, Budget FY 2026 – Historical Tables, Budget of the United States Government, Fiscal Year 2026, (US Government Publishing Office, 2026) and CBO, Key Budget and Economic Data: Economic Projections, dataset for February 2026, accessed February 12, 2026.
Notes: Cash payment benefits include tax provisions. Percentages may not sum to totals because of rounding. Data from 1960 to 1995 are captured every five years; data from 1996 onwards are captured yearly. Data through 2024 capture actual expenditures, while data for 2025 through 2035 are projections and are delineated by the gray line. Projections reflect current law as of January 14, 2026, and economic developments as of December 3, 2025.
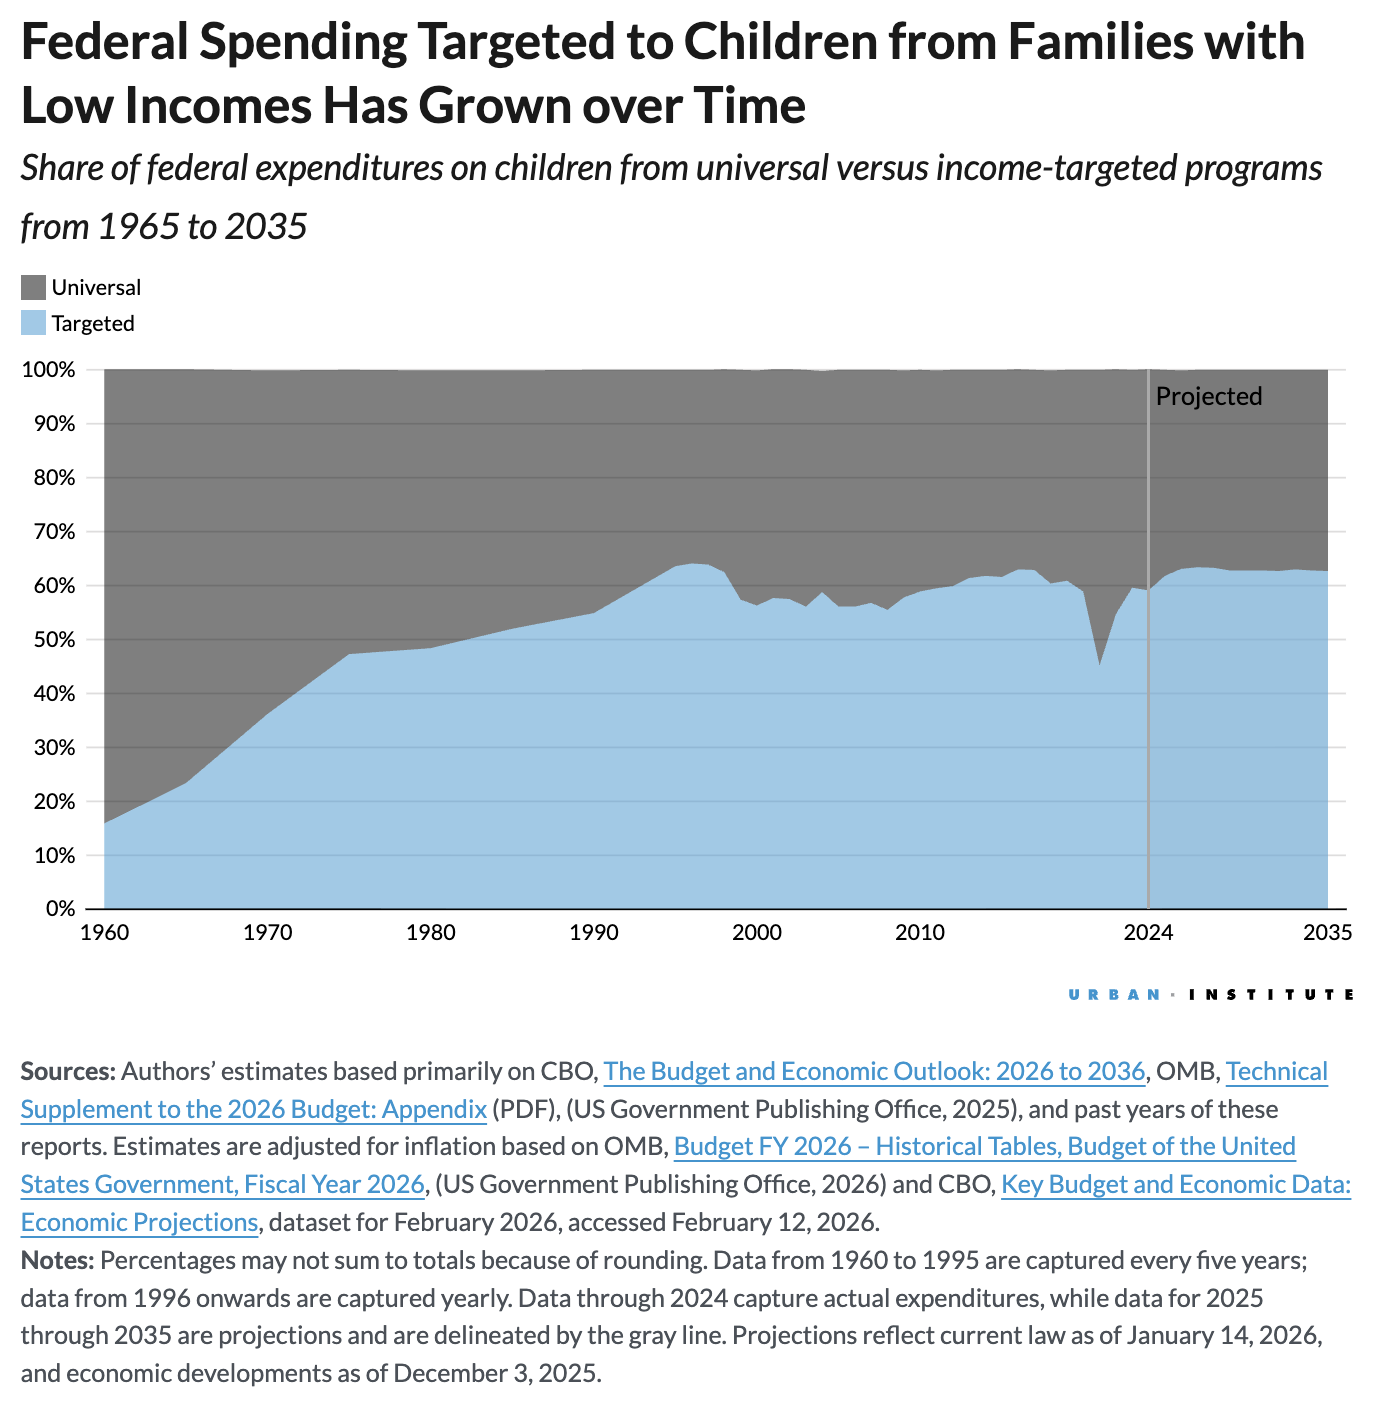
FIGURE 12
Federal Spending Targeted to Children from Families with Low Incomes Has Grown over Time
Sources: Authors’ estimates based primarily on CBO, The Budget and Economic Outlook: 2026 to 2036, OMB, Technical Supplement to the 2026 Budget: Appendix (PDF), (US Government Publishing Office, 2025), and past years of these reports. Estimates are adjusted for inflation based on OMB, Budget FY 2026 – Historical Tables, Budget of the United States Government, Fiscal Year 2026, (US Government Publishing Office, 2026) and CBO, Key Budget and Economic Data: Economic Projections, dataset for February 2026, accessed February 12, 2026.
Notes: Percentages may not sum to totals because of rounding. Data from 1960 to 1995 are captured every five years; data from 1996 onwards are captured yearly. Data through 2024 capture actual expenditures, while data for 2025 through 2035 are projections and are delineated by the gray line. Projections reflect current law as of January 14, 2026, and economic developments as of December 3, 2025.
Spending on Kids by Level of Government
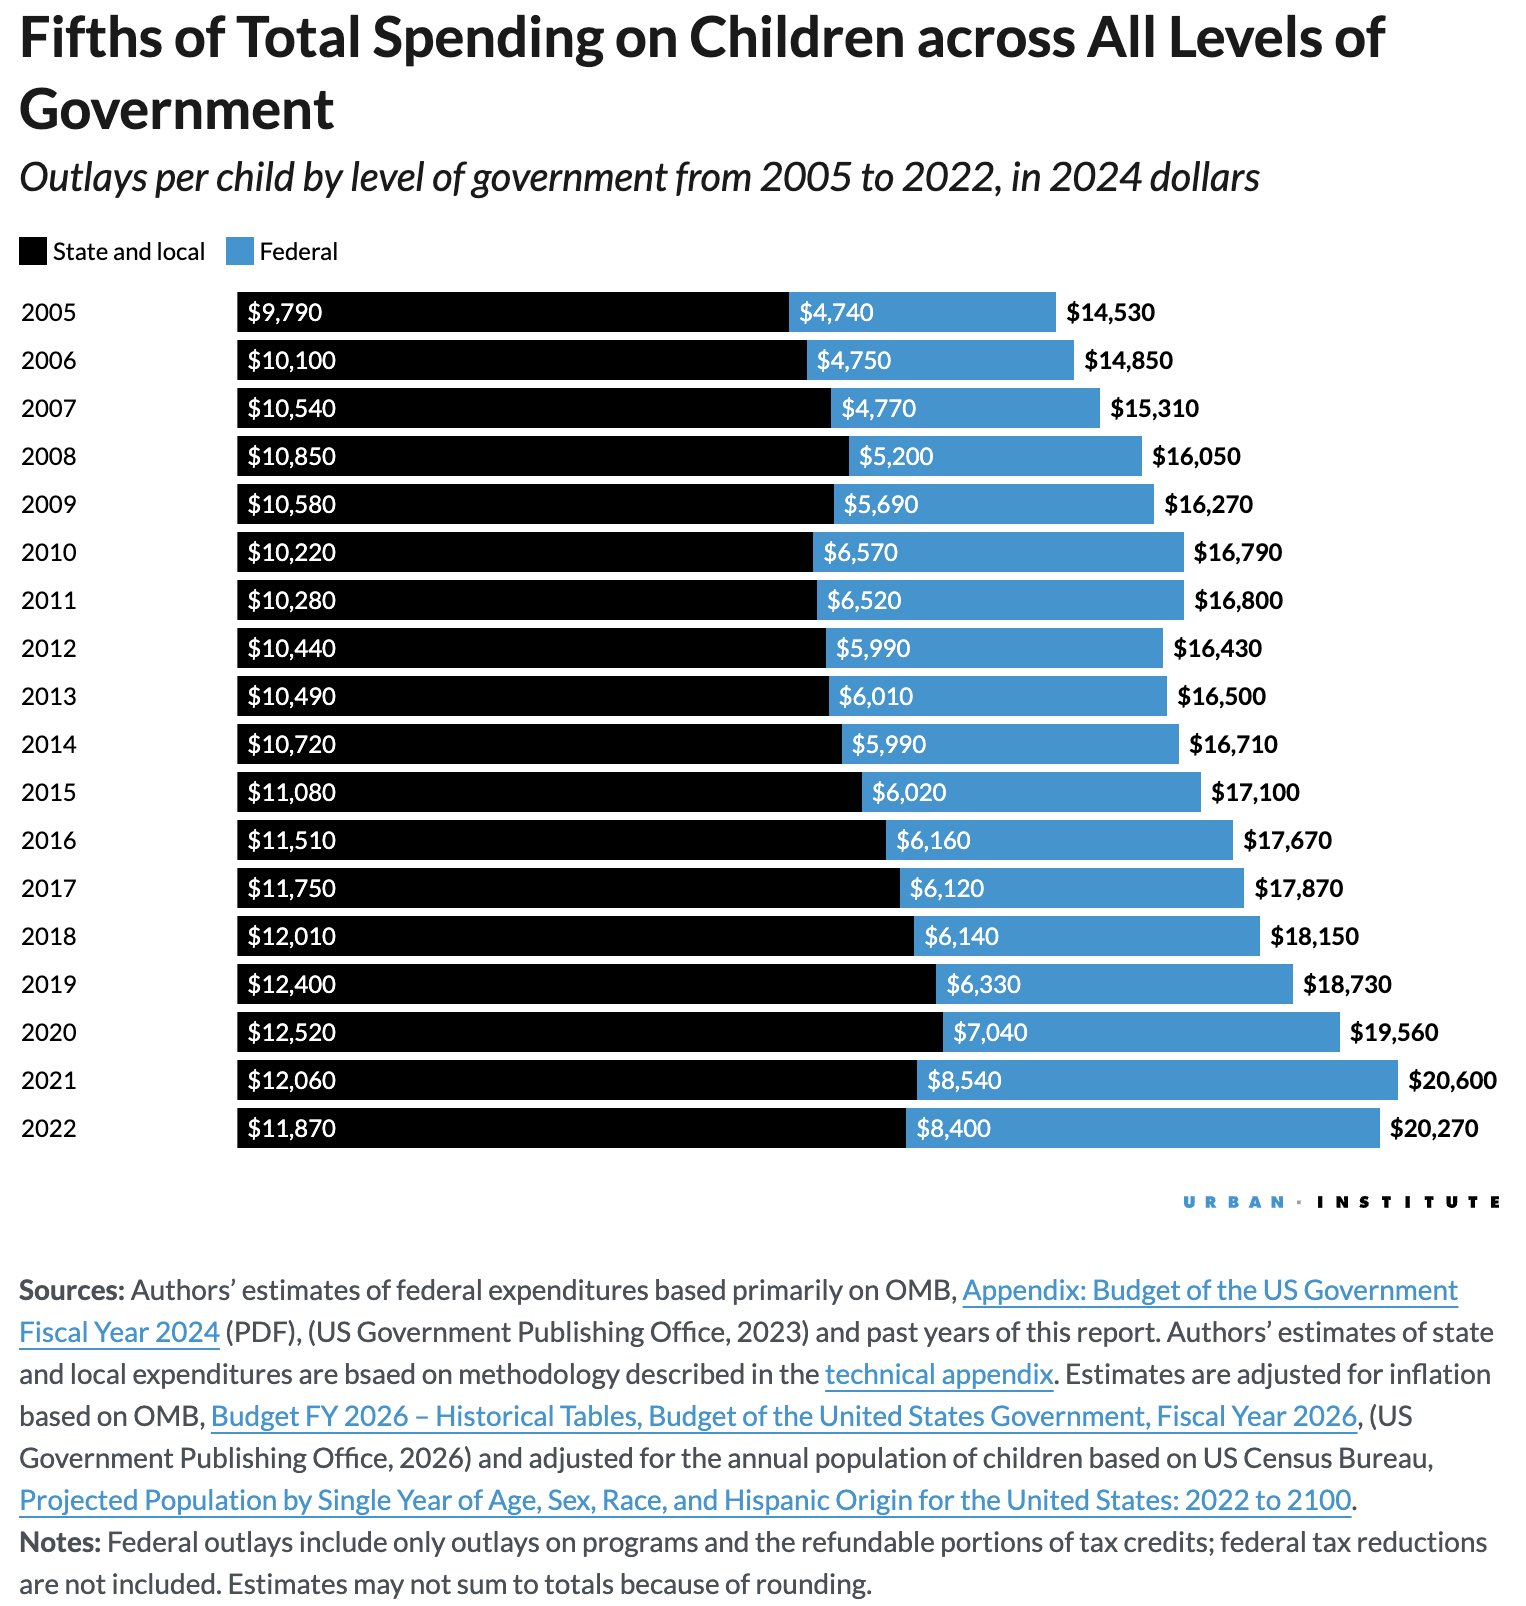
FIGURE 13
State and Local Governments Contribute about Three-Fifths of Total Spending on Children across All Levels of Government
Outlays per child by level of government from 2005 to 2022, in 2024 dollars
Sources: Authors’ estimates of federal expenditures based primarily on OMB, Appendix: Budget of the US Government Fiscal Year 2024 (PDF), (US Government Publishing Office, 2023) and past years of this report. Authors’ estimates of state and local expenditures are based on methodology described in the technical appendix (PDF). Estimates are adjusted for inflation based on OMB, Budget FY 2026 – Historical Tables, Budget of the United States Government, Fiscal Year 2026, (US Government Publishing Office, 2026) and adjusted for the annual population of children based on US Census Bureau, Projected Population by Single Year of Age, Sex, Race, and Hispanic Origin for the United States: 2022 to 2100.
Notes: Federal outlays include only outlays on programs and the refundable portions of tax credits; federal tax reductions are not included. Estimates may not sum to totals because of rounding.
FIGURE 14
State and Local Governments Primarily Invest in Children through Public Education Programs
Outlays per child for selected categories by level of government for 2022, in 2024 dollars
Sources: Authors’ estimates of federal expenditures based primarily on OMB, Appendix: Budget of the US Government Fiscal Year 2024 (PDF), (US Government Publishing Office, 2023). Authors’ estimates of state and local expenditures are based on methodology described in the technical appendix (PDF). Estimates are adjusted for inflation based on OMB, Budget FY 2026 – Historical Tables, Budget of the United States Government, Fiscal Year 2026, (US Government Publishing Office, 2026) and adjusted for the annual population of children based on US Census Bureau, Projected Population by Single Year of Age, Sex, Race, and Hispanic Origin for the United States: 2022 to 2100.
Notes: Federal outlays include only outlays on programs and the refundable portions of tax credits; federal tax reductions are not included. Estimates may not sum to totals because of rounding. The “other” state and local spending category includes state spending on Temporary Assistance for Needy Families, child support enforcement, state earned income tax credits, state matching funds for the Child Care and Development Fund, and state child welfare programs.
FIGURE 15
Federal Programs Make Up the Majority of Spending on Older Adults, While Most Spending on Children Is at the State and Local Level
Outlays per child and older adult by level of government for 2022, in 2024 dollars
Sources: Authors’ estimates of federal expenditures based primarily on OMB, Appendix: Budget of the US Government Fiscal Year 2024 (PDF), (US Government Publishing Office, 2023). Authors’ estimates of state and local expenditures are based on methodology described in the technical appendix (PDF). Estimates are adjusted for inflation based on OMB, Budget FY 2026 – Historical Tables, Budget of the United States Government, Fiscal Year 2026, (US Government Publishing Office, 2026) and adjusted for the annual population of children and older adults based on US Census Bureau, Projected Population by Single Year of Age, Sex, Race, and Hispanic Origin for the United States: 2022 to 2100.
Notes: Federal outlays include only outlays on programs and the refundable portions of tax credits; federal tax reductions are not included. Estimates may not sum to totals because of rounding.
Glossary of Terms
Children: People from birth through age 18.
Expenditures: Spending that includes both outlays and tax reductions.
Outlays: Direct spending from federal programs as well as the portions of refundable tax credits that exceed income tax liability (i.e., the refundable portion) and are included in families’ annual tax refunds.
Tax reductions: Reductions in families’ net income tax liabilities (and revenue losses to the federal government) resulting from tax exclusions, exemptions, deductions, and credits that benefit specific activities or groups of taxpayers. (This includes the portions of refundable tax credits that reduce what families owe in income and other taxes.)
Spending on children: Expenditures from both outlays and tax reductions that (1) benefit only children or deliver a portion of benefits directly to children; (2) increase benefit levels with increases in family size; or (3) require that families have a child to qualify (see technical appendix [PDF] for details on methods).
Discretionary spending: Government spending set by appropriations acts. Policymakers decide most appropriations on a periodic (usually annual) basis. Generally, none have the permanency of mandatory programs and many tax reductions. In recent years, discretionary spending has been constrained by spending caps set separately for defense and nondefense discretionary spending.
Mandatory spending: Government spending set by programmatic rules and not constrained by annual appropriations acts. This includes spending on entitlement programs and other programs designated by the Congressional Budget Office (CBO) as mandatory spending and the refundable portion of tax credits.
Older adults: People ages 65 and older.
Real or 2024 dollars: Expenditures that have been adjusted for inflation. All budget numbers represent federal fiscal years, which run from October 1 to September 30. We have expressed these in 2024 dollars unless otherwise noted.
Share of GDP: Calculated by taking a dollar value in real (i.e., inflation-adjusted) terms and dividing it by real GDP. As such, these figures account for both inflation and the changing size of the economy.
Refundable portions of tax credits: The dollar amounts of refundable tax credits that exceed families’ net income tax liability and are treated as outlays rather than tax reductions in budget accounts. Amounts of refundable tax credits that offset income and other taxes (like Social Security and Medicare taxes paid when a return is filed) are considered reductions in revenue.
Tax provisions: Tax benefits that reduce tax liabilities and thus reduce revenue (like exclusions, deductions, nonrefundable tax credits that offset income taxes, and the portion of refundable tax credits that offset income and other taxes), as well as the portion of the refundable tax credits that exceed income taxes owed.
Methodology
Estimating the portion of government expenditures on children requires making assumptions and decisions about how to classify federal, state, and local spending and tax data.
First, we identify programs that directly benefit children or households with children. Second, we collect expenditure data from federal sources on these programs, particularly the Office of Management and Budget’s (OMB’s) Technical Supplement to the 2026 Budget: Appendix and Historical Tables, Budget of the United States Government for fiscal year 2026 and prior years. We draw on OMB’s appendix volume for information on spending and the Department of Treasury’s Tax Expenditures, FY 2026 estimates which have historically been included in the Analytical Perspectives volume. We estimate the share of each program’s expenditures that directly benefit children and calculate the dollar value of these expenditures.
Kids’ Share reports do not judge the success of each current expenditure on meeting children’s needs, nor do they measure or incorporate private spending on children. The reports do not prescribe an optimal division of public dollars or resources.
Below we describe each step in our methodology. We also discuss our methods for estimating expenditures on older adults, state and local estimates, future projections (based heavily on CBO projections) and methodological changes made in this year’s report (see technical appendix [PDF]).
Defining and Identifying Programs Benefiting Children
Like all budget exercises that allocate spending to categories, identifying spending that goes to children is a complex task that could be calculated using different methodologies. Each dollar spent on a particular program must be determined to go to a particular recipient. This task is relatively straightforward for programs that only spend directly on children—elementary education is a simple example.
But for programs that serve both children and adults, discerning who benefits from spending is more difficult. For example, how should one determine the amount of refundable tax credits, such as the earned income tax credit (EITC), distributed to adults rather than children?
As such, calculating spending on children and comparing data over time require a concrete and consistent set of rules and assumptions.
To be included in this analysis, a program (as a whole or in part) must meet at least one of the following criteria:
- Benefits or services are provided entirely to children (e.g., K–12 education programs or Head Start) or serve all age groups but deliver a portion of benefits directly to children (e.g., Supplemental Security Income [SSI] payments for children with disabilities or Medicaid services for children).
- Family benefit levels increase with family size (e.g., Supplemental Nutrition Assistance Program [SNAP] or low-rent public housing).
- Children are necessary for a family to qualify for any benefits (e.g., Temporary Assistance for Needy Families [TANF] or the child tax credit [CTC]).
Therefore, some services that may benefit children are excluded from our calculations because they do not directly rely on the presence of a child. For example, unemployment insurance and some tax benefits for homeownership may benefit children, but they do not meet the criteria for inclusion in our analysis because being a child or having a child are not prerequisites for these services and because having a child does not result in any additional direct monetary benefit. Further, we do not include programs generally classified as public goods that provide benefits to the general population, such as roads, communications, national parks, defense, and environmental protection.
In reporting federal expenditures on children, our most comprehensive measure includes tax reductions (e.g., reduced tax liabilities as a result of the CTC, the dependent exemption, or other provisions in the tax code) as well as direct outlays paid out for the refundable portion of tax credits and from programs such as Medicaid, child nutrition programs, and education programs.
In other places, we focus solely on budget outlays for children, such as when we report the share of total federal outlays spent on children. Some tax provisions are included in our estimates as outlays: the portions of the EITC and CTC paid out to families as a tax refund (and treated in our estimates as outlays rather than as reductions in tax liabilities), as well as the outlay portions of smaller tax provisions (e.g., outlays associated with Qualified Zone Academy Bonds). The division of tax subsidies between outlays (for the refundable portion of credits) and tax reductions (for the nonrefundable portion) adheres to standard budget accounting practices used by the OMB, Department of the Treasury, and Joint Committee on Taxation.
Collecting Expenditure Data
Expenditure data on program outlays largely come from the Technical Supplement to the 2026 Budget: Appendix and prior years’ appendices. Tax Expenditure estimates from the US Treasury are generally found in the Analytical Perspectives volume of the budget as well as in Department of Treasury’s Tax Expenditures, FY 2026. For programs not included in the appendix, we obtain expenditure data from the relevant agencies’ budgetary documents or their representatives (see technical appendix [PDF] for more details). For the analyses presented in this report, all budget numbers represent fiscal years, and we have expressed them in 2024 dollars unless otherwise noted.
Estimating Spending on Older Adults
Although Kids’ Share focuses on federal expenditures on children, we also have developed rough estimates of expenditures on older adults, namely, spending in 16 programs: Social Security, Medicare, Medicaid, SSI, SNAP, veterans’ benefits, railroad retirement, unemployment compensation, federal civilian retirement, military retirement, Special Benefits for Disabled Coal Miners, veterans’ medical care, annuitants’ health benefits, housing, the Administration for Community Living (previously the Administration of Aging), and the Low Income Home Energy Assistance Program. For 2021, we also include expenditures on economic impact payments (pandemic-related stimulus checks) administered through the tax code. As with our methodology for children, we estimate the share of the program that goes to older adults; for example, we subtract expenditures on children and disabled adults ages 18 to 64 to estimate older adults’ share of expenditures for Social Security, Medicare, and Medicaid.
However, except in estimates denoted as expenditures on “older adults,” our estimates for the adult portions of Social Security, Medicare, and Medicaid include all spending on people ages 19 and older.
Estimating State and Local Spending
Although this report focuses on federal expenditures on children, it also includes estimates of state and local outlays on children from 2005 to 2022. State and local expenditure data are typically delayed by several years, which is why we do not present more recent estimates.
Estimates through 2008 are drawn from the Rockefeller Institute of Government’s State Funding for Children Database, as described by Billen and colleagues (2007); estimates for 2009 and onwards are by the Kids’ Share authors. Both sets of estimates focus on state and local expenditures for pre-K through 12 education, state EITCs, and several joint federal–state programs (Medicaid, the Children’s Health Insurance Program [CHIP], Maternal and Child Health Block Grants, TANF, child support enforcement, child care, and several child welfare programs). Data sources for 2009 and after include the US Census Bureau’s Annual Survey of School System Finances, unpublished tabulations of Medicaid claims (Medicaid Statistical Information Statistics data), the websites and reports of various federal agencies, and information from the IRS compiled by the Urban-Brookings Tax Policy Center. We estimated shares of outlays on children for Medicaid, TANF, and CHIP; the other state programs were programs that could be assumed to spend 100 percent on children (i.e., child care, child welfare, and CHIP).
Calculating Projections
To estimate future trends in expenditures on children from FY 2025 to FY 2035, we primarily use the CBO’s The Budget and Economic Outlook: 2026 to 2036. Released in February 2026, these budget projections reflect “economic developments and laws in place as of December 3, 2025…[and] incorporate the effects of laws in place as of January 14, 2026.”
Because of the years reflected in these projections, some estimates for FY 2025 are from CBO’s The Budget and Economic Outlook: 2025 to 2035. In these cases, our projections for FY 2025 reflect laws in place as of December 4, 2024.
To project tax provision expenditures from FY 2025–35, we use the Urban-Brookings Tax Policy Center Microsimulation Model for major provisions and the Department of Treasury’s FY 2027 Tax Expenditure Estimates for smaller provisions.
We use different projection methodologies depending on whether a program is mandatory, discretionary, or a tax provision:
- Mandatory spending. The CBO baseline projections assume a continuation of current law, except certain expiring programs that have been continually reauthorized in the past are also assumed to continue. In general, for programs serving both children and adults, we assume that the share of expenditures directed to children for each program will remain constant from 2025 to 2035. However, we use the CBO’s detailed projections by age group for Medicaid, Social Security, and SSI to calculate the share of spending going to children in future years.
- Discretionary spending. With spending set by appropriations actions, the CBO traditionally uses a baseline assumption that spending is kept constant in real terms—that is, spending is based on the most recent year’s appropriation, adjusted for inflation. Our statements about future spending generally focus on spending as a whole and in broad categories, such as health and education, or types of spending, such as mandatory and discretionary, given the tentative nature of budget projections.
- Larger tax provisions. The Urban-Brookings Tax Policy Center Microsimulation Model provides 10-year projections for major children’s tax provisions including the CTC, EITC, dependent exemption, pandemic-related economic impact payments (stimulus checks), and child and dependent care credit. The model also projects revenue losses associated with the exclusion of employer-sponsored insurance (ESI) from income. These projections are made assuming continuation of current law as of July 5, 2025.
- Smaller tax provisions. We use the 10-year projections from Treasury’s Tax Expenditure estimates. (Note: Treasury’s estimates are the same as OMB’s Analytical Perspectives tax expenditure estimates used in previous Kids’ Share reports).
Adjusting Estimates to Enable Comparisons over Time
We present all estimates in terms of inflation-adjusted 2024 dollars using GDP data from OMB’s Historical Tables and CBO’s Budget and Economic Outlook. This allows us to compare expenditures over time.
Beyond real spending estimates, we also calculate a variety of other adjustments to compare data in common terms:
- Share of GDP: To understand how spending on children has changed relative to the size of the economy, we present estimates of spending as a share of GDP. We divide our inflation-adjusted spending estimates by the real GDP of the corresponding year, using data from OMB and CBO. Examining spending relative to the economy can reveal how spending changes as the economy grows.
- Per-person expenditures: To estimate how spending levels average out per person, we divide inflation-adjusted spending estimates by the total number of children up to age 18 and the total number of adults ages 65 and older in a given year, according to estimates from the US Census Bureau. When comparing these per-person estimates over time, we can see how spending has changed while accounting for population differences.
Changes in This Year’s Report
In this year’s report, we used CBO’s The Budget and Economic Outlook: 2026 to 2036 as our main source for projected expenditures from FY 2026 to FY 2035. We made this decision given these budget projections accounted for major changes in spending resulting from the 2025 budget reconciliation act. However, these CBO projections did not always include estimated or actual expenditures for FY 2025. For select programs (including Medicaid, SNAP, and SSI), CBO published actual expenditures for 2025, which we used in lieu of prior years’ projections. For all other programs’ FY 2025 projections, we followed the same methodology but used CBO’s The Budget and Economic Outlook: 2025 to 2035.
The 2025 budget reconciliation act created new Section 530A accounts or “Trump accounts.” These tax-advantaged investment accounts are available to children under age 18 who have a Social Security number. Children born between 2025 and 2028 are eligible for a $1,000 deposit from the federal government. Treasury estimates these accounts will cost $14.6 billion over the 10-year budget window, with the vast majority of costs coming from the seed funding. Although children are necessary for a family to qualify for this benefit, we do not include these accounts in Kids’ Share because the benefits from the accounts do not accrue to children. In almost all cases, no funds may be withdrawn from an account until a child reaches age 18. At that point funds can be withdrawn, typically with a penalty imposed. We have no basis for estimating the likelihood of this, rather than waiting to withdraw the accounts at retirement.
Acknowledgements
Funding for this report was provided by Annie E. Casey Foundation and the Peter G. Peterson Foundation. We are grateful to them and to all our funders, who make it possible for Urban to advance its mission. The views expressed are those of the authors and should not be attributed to the Urban Institute, its trustees, or its funders. Funders do not determine research findings or the insights and recommendations of our experts. More information on our funding principles is available here. Read our terms of service here.
We thank all former members of the Kids’ Share team—especially Julia B. Isaacs, Cary Lou, and C. Eugene Steuerle—for their work on past reports and for informing the methods and study design. We thank the TRIM, HPSIM, and Tax Policy Center modeling teams and the researchers and government employees who shared data and insights that informed our analysis.
Research Elli Nikolopoulos, Heather Hahn, Margot Crandall-Hollick, Eden Phillips, Elaine Maag, Hannah Daly, Apueela Wekulom
Data visualization and development Aaron R. Williams, Mitchell Thorson, Jon Schwabish
Editing Alex Dallman, Dana Ferrante
Suggested Citation
Elli Nikolopoulos, Heather Hahn, Margot Crandall-Hollick, Eden Phillips, Elaine Maag, Hannah Daly, and Apueela Wekulom. 2026. Kids’ Share 2025: Report on Federal Expenditures on Children through 2024 and Future Projections. Washington, DC: Urban Institute.