IMMIGRANT SHARE OF POPULATION TRACT SOCIOECONOMIC STATUS Middle 80% Highest 10% 20% 30% 10% 50% 40% Lowest 10% Highest SES, high immig. Lowest SES, high immig. Lowest SES, low immig. Highest SES, low immig.

How Immigrants Are Reshaping Residential Segregation

Even as the United States becomes more diverse, residential segregation still divides many American cities. Though the problem has historically centered on the stark separation between lower-income black and higher-income white neighborhoods, immigrants have added a new dimension to the picture, particularly after the past four decades of increased immigration from across Latin America and Asia.

Just like US-born white, black, Hispanic, and Asian residents, immigrants from different world regions sort into neighborhoods across cities in patterns strongly shaped by the racial and ethnic and socioeconomic characteristics of those neighborhoods. Here, we present the patterns of racial segregation of immigrants in several cities by socioeconomic status (SES) and how this varies by the key characteristics of each city.

Where immigrants live matters for several reasons. It affects how parents pass on opportunities or disadvantages to their children, such as whether families are close to high-quality schools, needed services, safe outdoor spaces for play and exercise, and grocery stores with affordable, nutritious food. Neighborhoods can shape how easily immigrants can access products, services, and assistance in a way that fits with their cultural and language needs. And neighborhoods shape families’ social networks and the resources, influences, and help available through those networks.

Using the Neighborhood Change Database, we identified seven cities (technically, seven commuting zones: regions of metro and rural areas connected by a local economy) that exemplify three patterns of how immigrant families sort into neighborhoods.

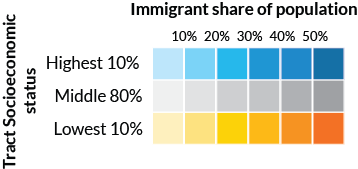
Using the Neighborhood Change Database, we looked at Census data on neighborhoods’ average household income, median house value, share of college degrees, and homeownership rate to determine their socioeconomic advantage. We then analyzed the most disadvantaged neighborhoods within each local area (those in the bottom 10 percent, or “lowest-SES” for the city) and the most advantaged (those in the top 10 percent, or “highest-SES” for the city) to map neighborhood inequality within communities.
Related Feature

Rent Burden High in Low- and High-Cost Metros Alike

Housing has become prohibitively expensive for nearly half of all renters in America.


Ethnic Distribution by Neighborhood Type in Traditionally Segregated Cities, 2010

Traditionally Segregated Cities

Both Chicago and DC exhibit stark segregation between black and white neighborhoods, with the highest-SES areas primarily made up of white residents and the lowest-SES areas primarily made up of black residents. This dichotomy has changed little over the past two decades.

Both cities have also attracted large numbers of immigrants. For the most part, immigrant residents have avoided both the traditionally black, lowest-SES communities and the traditionally white, highest-SES communities, instead settling into the middle-SES neighborhoods.


Fast-Growth Cities

Many cities in the South and Southwest have seen fast growth in their overall populations and in their immigrant populations over the 1990s and 2000s. Atlanta, Houston, and Las Vegas all saw their immigrant populations more than double between 1990 and 2010. In fact, the foreign-born population of Atlanta was five times bigger in 2010 than in 1990.

These fast-growth cities are also all places where immigrants cluster strongly in the poorest neighborhoods, forming growing shares of residents in the lowest-SES neighborhoods. Immigrants make up 15, 20, and 22 percent of the populations of Atlanta, Las Vegas, and Houston, respectively. But they make up 17, 31, and 32 percent of all residents in the lowest-SES neighborhoods in these areas.

In all three cities, the majority of immigrants were born in Mexico or other parts of Latin America, followed by immigrants from various parts of Asia and then Europe. Latin American immigrants are particularly concentrated in the lowest-SES neighborhoods, while immigrants from Asia and Europe are over concentrated in the highest-SES neighborhoods.

Looking now at US-born residents, those in the poorest neighborhoods in Houston are mainly black and Hispanic. In Atlanta, segregation among US-born residents echoes the black-white segregation observed in Chicago and DC: about two-thirds (65 percent) of residents in the lowest-SES neighborhoods are black. In Houston, about one-third (34 percent) of residents in the lowest-SES neighborhoods are black, while 19 percent are US-born Latinos. In contrast, in Las Vegas, 30 percent of residents in the poorest neighborhoods are US-born non-Hispanic whites, while 17 percent are US-born Hispanics.

Ethnic Distribution by Neighborhood Type in Fast-Growing Cities, 2010

Share of Foreign Born, by Neighborhood Type, 2010

Tech Cities

San Jose and Seattle have booming tech industries that draw large numbers of high-skilled immigrants and US-born workers alike. These high-skilled immigrants, who often make high salaries, opt to move into the highest-SES neighborhoods in both cities.

Although both cities attract high-skilled immigrants, each is also home to other types of immigrants. Many of the immigrants living in Seattle are refugees, mostly from Cambodia, Russia, and Somalia, who settle in the lowest-SES areas. In San Jose, a large number of poorer Latin American immigrants tend to settle in the lowest-SES areas. This combination of immigrants—high-skilled workers, refugees, and poorer Hispanic households—means that immigrants make up a greater share of the lowest-SES neighborhoods and a greater share of the highest-SES neighborhoods.


Other US Cities

Beyond these seven cities, immigrants’ residential patterns are influencing the composition of neighborhoods and cities across the United States. All three of these trends play out at the same time in places like Los Angeles and New York—gateway cities that are home to sizeable immigrant populations and several generations of overlapping residence patterns. And, in cities such as Minneapolis, MN, a large share of the foreign-born population consists of resettled refugees. Immigrants tend to concentrate in the lowest-SES neighborhoods in these high-refugee cities, but overall patterns depend on the characteristics of other (nonrefugee) residents who also live in these areas.


What's Next?

Neighborhood and class segregation is no longer just a black-white story. Immigrants from Latin America and Asia make up a substantial proportion of US neighborhoods across the SES spectrum. As they shape and are shaped by the neighborhoods they reside in, immigrants play an increasing role in the inequality story playing out across US communities. Discussions of residential segregation need to consider the wide diversity in the country’s immigrant populations. Immigrants from different parts of the world bring different educational, occupational, and language skills with them, along with different sets of needs and preferences. In considering how to address problematic patterns of segregation, these particular strengths and needs must be considered.