Chapter 3
Housing
Home sale prices still high after the housing bubble burst
Home sale prices were relatively flat in the late 90s, but in the early 2000s—as DC’s population grew for the first time in 50 years—prices skyrocketed, reaching historic highs. Though median prices fell a little during the housing market crash, they didn’t come down much and have continued to stay high after the recession ended. The Washington region remains one of the most expensive housing markets in the country.
The story is a little different in each ward. In the late 90s, homes in Wards 2 and 3 were considerably more expensive than homes in other areas, with median home prices around $500,000 in early 1996. Median prices in other wards, meanwhile, were clustered together between $100,000 and $200,000 until 2001, when a few wards rose above the pack. Gentrifying neighborhoods pushed up prices in Wards 1 and 6 to over $600,000 by the end of 2013. Increases followed a bit later in Wards 4 and 5, as homebuyers began looking in more parts of the city to find affordable homes.
Prices also rose in Wards 7 and 8, but have since fallen to the low $200,000s. While Wards 2 and 3 still lead by a good margin, other wards are more spread out across the price spectrum now than in the 1990s.
High-cost units account for a bigger share of rentals
Affordable rental options are critical for diverse communities. Some renters may not be able to afford to buy a home, at least not yet, while others may want or need to be more mobile. Low-income families and workers depend on the rental market to find adequate housing, but DC renters are losing lower-cost options.
While the rental market has grown—from 2005 to 2012, roughly 12,500 more apartments and homes were occupied by renters—the number of lower-cost, market-rate units fell steadily, as higher-rent units took over a greater share of rentals.
In 2005, over 65,000 rentals were available for under $800 a month (in 2012 dollars); by 2012, that number had fallen to roughly 34,000 units. Meanwhile, the number of rentals for $1,000 or more shot up from about 51,000 units in 2005 to nearly 98,000 in 2012.
Young, highly educated new residents are driving demand
They’re young and highly educated: they’re the newcomers who have been driving the residential building boom in DC.
In 2011, nearly 67 percent of people who moved to the city within the past year were ages 18 to 34, up from 57 percent in 2005. Meanwhile, only 30 percent of current residents were in that age range. The share of new residents with bachelor's and graduate degrees (65 percent) in 2011 was higher than the share of degree-holders already living in the city then (42 percent).
A higher share of newcomers than current residents in 2011 were two-person households without children (38 percent versus 27 percent), while more current residents than newcomers had children (38 percent versus 22 percent). Single-person households made up roughly the same share in both groups.
A slightly bigger share of newcomers than current residents were in the middle- and high-income categories, and fewer new residents had extremely low incomes, but the real differences may be yet to come. The data capture earnings of young, highly educated newcomers who are just starting out in the job market, but many are poised to earn more later in their careers.
Share of 2011 DC Residents by Where They Lived a Year Ago
Building boom transforming DC neighborhoods
Construction cranes are a fixture of DC’s skyline. Luxury condos have popped up in Columbia Heights, NoMa, Shaw, and the Waterfront, transforming whole communities. From 2002 to 2013, approximately 600 condo developments, 4,000 single family homes, and 680 rental apartment buildings have been built or converted from vacant or nonresidential properties. And, according to the Washington, DC Economic Partnership, about 9,700 rental units were under construction in 2012 and nearly 18,500 units were in the pipeline.
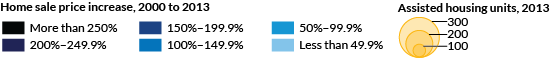
About this map
NeighborhoodInfo DCderived the data for this map from real property records maintained by the DC Office of Tax and Revenue and provided by the Office of the Chief Technology Officer (OCTO). The records include information on parcel use (e.g., residential or commercial), type of property on the site, and the year the property was built. The colored areas are land parcels with residential properties built between 2002 and 2013 or parcels that showed changes from nonresidential to residential uses. Parcel boundaries were obtained from an OCTO map file, which is overlaid on a base map displaying streets and building footprints. In some cases, a colored area with new housing may represent a larger parcel that was later divided into multiple types of uses, only some of which are residential.
Source: DC Office of Tax and Revenue real property data tabulated by NeighborhoodInfo DC.
DC is increasingly unaffordable for lower-income residents
While economic growth and the building boom have revitalized DC communities, many lower-income residents haven’t shared in that prosperity. As the cost of housing rises, DC has become increasingly unaffordable, going by the widely used standard that only 30 percent of income should be spent on housing. Many households in DC spend much more than that on rent or mortgage payments, leaving less for food, health care, and other basic needs.
How affordable (or unaffordable) is DC? Let’s consider what households with different incomes can afford. The US Department of Housing and Urban Development categorizes households by how they compare with the median income in an area. In 2011, the median income in the Washington region was $106,100 for a family of four. That means that a four-person family supported by, say, a paramedic earning $46,400 a year is considered very low income and can afford to pay up to $1,160 a month for rent. The same-sized family supported by a dental hygienist earning $90,460 is middle income and can afford $2,262 a month in rent.
From 2000 to 2011, the number of rentals that were affordable for low-income, very low-income, and extremely low-income households either fell or increased only slightly, while the number of rentals that only middle- or high-income households could afford rose rapidly, particularly for studio and one-bedroom apartments that would be suitable for one- or two-person households.
Number of Affordable Units by Income Level

Sources: US Census 2000 and American Community Survey 2011 microdata (obtained from IPUMS-USA) tabulated by NeighborhoodInfo DC.
Assisted housing at risk in fast-growing neighborhoods
For households that can’t afford market-rate housing, assisted housing programs fill an essential gap between what these households can pay and what the unit costs. Close to 8,000 DC families live in public housing and 10,500 receive federal housing vouchers. Others (as many as 28,000 households) live in privately-owned assisted housing. But the waiting list for rental assistance is long, with over 67,000 households in line for a voucher or public housing. In recent years, federal spending on assisted housing has fallen and DC has put forward its own resources to help fill the gap.
Assisted housing can be found in many neighborhoods throughout the city—including areas that are growing rapidly and those that haven’t grown much yet. Fast-growing neighborhoods, like Shaw and Logan Circle, have become expensive, putting subsidized housing there at risk. Owners and developers may decide it is more lucrative to switch from providing assisted housing to providing luxury apartments or condominiums. Losing assisted units in these neighborhoods would be devastating as it would then become extremely difficult, if not impossible, to create new assisted apartments in these neighborhoods.
Zooming in: Chinatown/Penn Quarter/Mount Vernon Square
From 2002 to 2013, the Chinatown/Penn Quarter/Mount Vernon Square area saw a surge of new development. The number of condo units shot up from 830 in 2002 to 4,500 in 2013, the biggest increase of any DC neighborhood cluster. This area also had the largest percentage growth in population in the city at 58 percent.
Much of this new development has revitalized vacant or worn-out properties, but it has also put the area's assisted housing at risk of being demolished and replaced with high-cost, market-rate homes and apartments. In rapidly developing areas like this, preserving existing assisted housing is crucial to maintaining affordability and diversity for current and future residents.
| Population | |
| Population, 2000 | 8,609 |
| Population, 2010 | 13,560 |
| Change in population (percent) | 58 |
| Condos | |
| New condo units added between 2002 and 2013 | 3,700 |
| Number of condo units before 2002 | 830 |
| Median condo sales price in 2000 (in 2013 dollars) | $222,900 |
| Median condo sales price in 2002 (in 2013 dollars) | $330,200 |
| Median condo sales price in 2013 (in 2013 dollars) | $460,000 |
| Assisted housing | |
| Assisted housing units in 2013 | 2,840 |
Creating and preserving affordable housing
If we want to maintain DC as an inclusive and diverse city, we need to provide a diversity of housing that meets the needs of all residents—owners and renters, high-income and low-income households, single adults and large families. That’s the consistent message from past city administrations and from Mayor Vincent Gray’s housing task force, which, in 2013, came up with a long-term affordable housing strategy for the city. Gray has pledged $100 million toward achieving one of the task force’s main goals: creating and preserving 10,000 new subsidized housing units by 2020. City officials said that DC is halfway there, with 5,938 units built or under construction.
The Housing Production Trust Fund and the DC Local Rent Supplement Program, which use local tax dollars to subsidize developers and providers of affordable housing, are critical to achieving the task force’s goals. DC’s Inclusionary Zoning policy, implemented in 2009, also may prove to be an important tool to spur development of affordable housing and mixed-income communities. The policy requires that new residential buildings set aside a percentage of its units for low- and moderate-income households. The policy has gotten off to a slow start, but is beginning to make progress.
But the needs are still great. As DC continues to grow, inclusive housing policies will help ensure that the city remains affordable for all its residents.
Credits
Written by Peter Tatian and Serena Lei
Research by Peter Tatian, Leah Hendey, and Katya Abazajian
Visuals by Tim Meko
Photos by Zach McDade and Matthew Johnson